Package: Invicti AppSec Core (on-demand)
Dashboard overview
The Dashboard provides a comprehensive view of your application security posture through two main tabs: AppSec and API Insights.
The Dashboard automatically loads the most recent data and updates as new scans complete and vulnerabilities are discovered or resolved. Metrics may take a few moments to populate after login due to dynamic loading.
False positive and risk accepted vulnerabilities are automatically excluded from all charts and metrics.
Why this matters
Without a central view of your security posture, it's easy to lose track of where vulnerabilities stand, how long they've been open, and whether remediation efforts are actually working. The Dashboard brings all of this into one place - giving you real-time metrics, trend data, and risk indicators across your projects and APIs so you can prioritize work, track progress, and report on security health without running individual reports.
AppSec tab
The AppSec tab displays your organization's overall security posture through a set of key metrics, cards, and charts.
Summary metrics
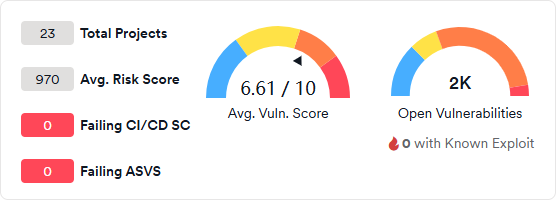
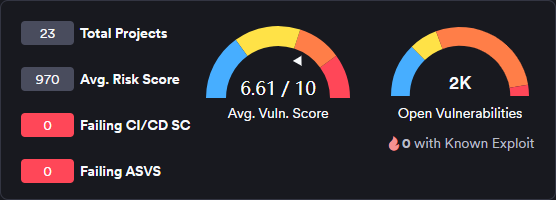
The top section shows four high-level KPIs and two vulnerability gauges:
- Total Projects: the total number of projects in your organization.
- Avg. Risk Score: the average risk score across all projects.
- Failing CI/CD SC: the number of projects failing CI/CD security checks.
- Failing ASVS: the number of projects failing ASVS compliance checks.
- Avg. Vuln. Score: the average vulnerability score across all projects, shown on a scale of 0 to 10.
- Open Vulnerabilities: the total count of open vulnerabilities, including a count of those with known exploits.
Metric cards
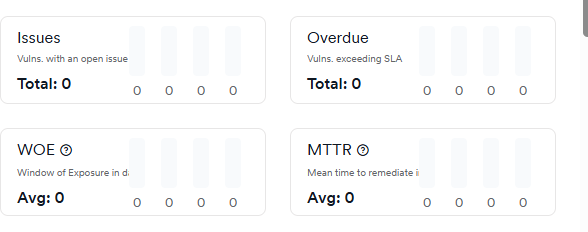
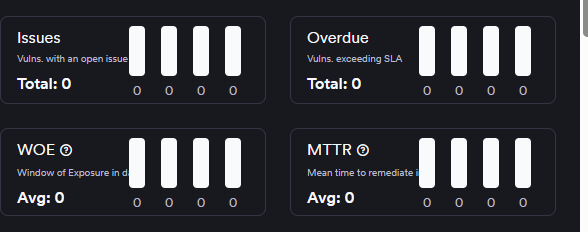
Four cards provide detailed breakdowns of key security indicators:
- Issues: vulnerabilities with an open issue, broken down by severity.
- Overdue: vulnerabilities exceeding their SLA remediation deadline, broken down by severity.
- WOE (Window of Exposure): the average time vulnerabilities remain open and exploitable.
- MTTR (Mean Time to Remediate): the average time taken to fix vulnerabilities from discovery to resolution.
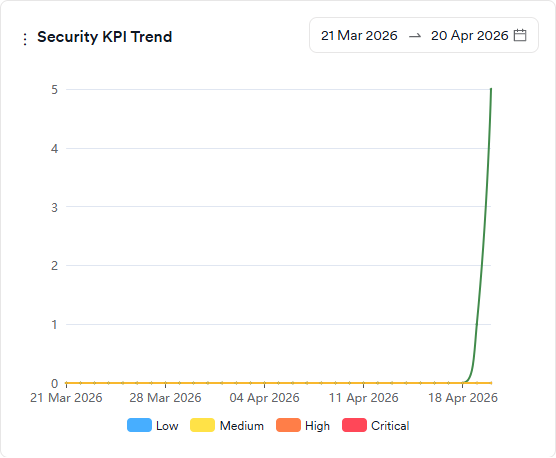
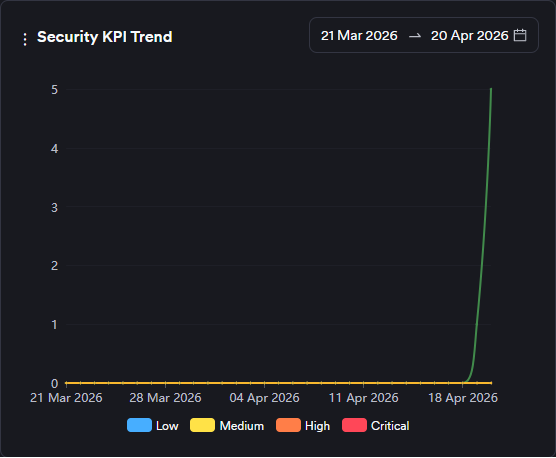
Security KPI trend
Tracks five key security metrics over a selected date range, broken down by severity:
- Time to first response: how long the security team takes to triage a vulnerability on average.
- Time to first action: how long the development team takes to start working on a vulnerability on average.
- Time to resolution: the average time the development team spends on a vulnerability.
- Time to remediate: how long it takes to close vulnerabilities on average.
- Go-live delay: how long it takes for vulnerabilities to disappear after the issues are closed on issue trackers on average.
Severity categories can be filtered by clicking the severity legend at the bottom.
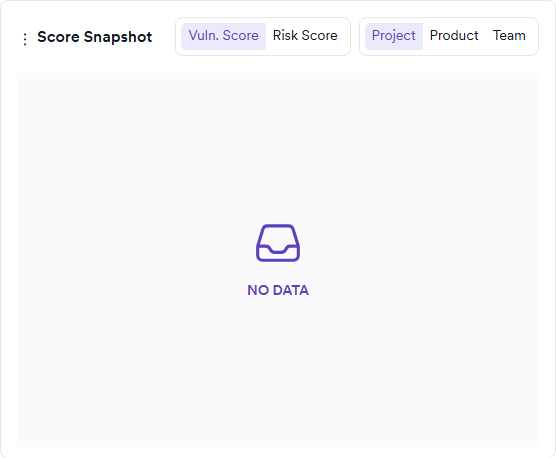
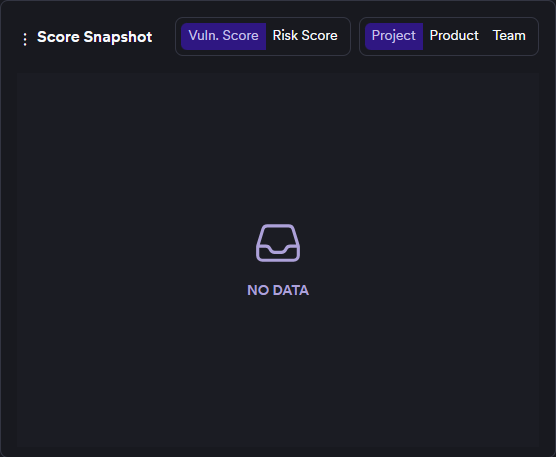
Score snapshot
Shows the risk or vulnerability score (Y-axis) against the number of vulnerabilities (X-axis) for each project or team. Colored circles indicate performance relative to average: green for better than average, yellow for slightly worse, and red for significantly worse. A blue circle marks the intersection of the average risk score and average findings.
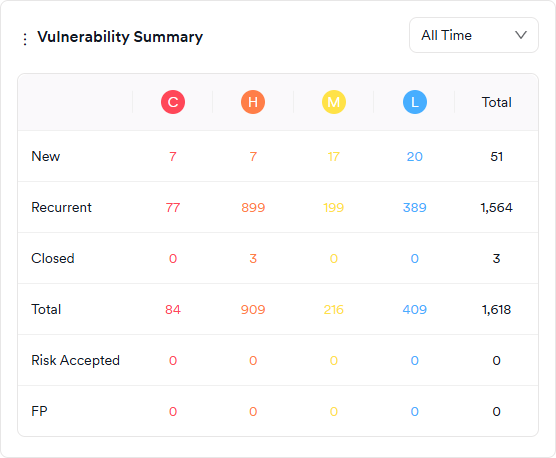
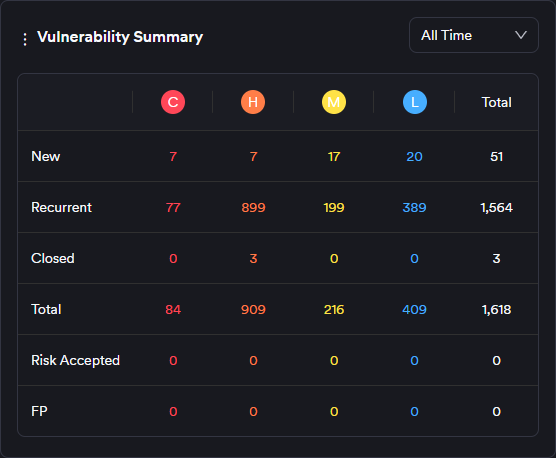
Vulnerability summary
A table showing the overall vulnerability situation, updated as new scans complete or vulnerabilities are marked as false positives or risk accepted. Counts are broken down by status (New, Recurrent, Closed, Risk Accepted, False Positive) and severity (Critical, High, Medium, Low).
- New: vulnerabilities discovered for the first time. Vulnerabilities that were closed and rediscovered are classified as recurrent, not new.
- Recurrent: vulnerabilities discovered in two or more consecutive scans, including those that were closed and then rediscovered.
- Closed: vulnerabilities that disappeared in a subsequent scan after being discovered.
- Risk Accepted: vulnerabilities marked as Won't Fix or Mitigated - excluded from all charts and metrics.
- False Positive: vulnerabilities marked as false positive by the user or scanner - excluded from all charts and metrics.
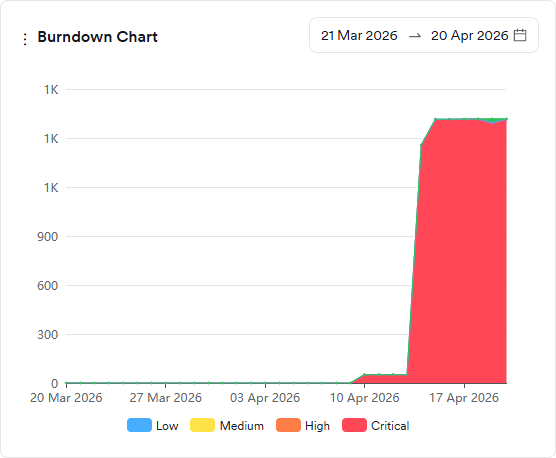
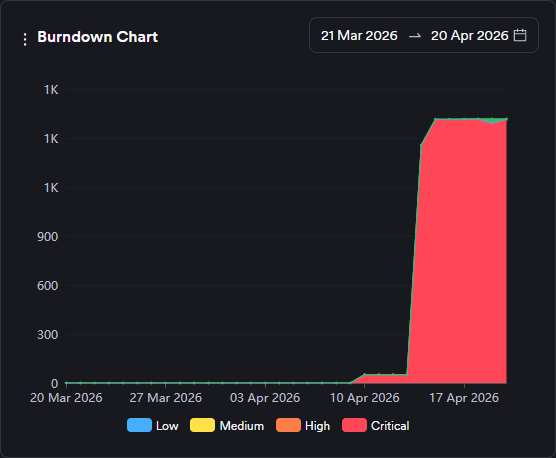
Burndown chart
Shows the evolution of open and closed vulnerabilities over a selected date range. The green area represents the sum of open and closed vulnerabilities; the red area represents open vulnerabilities only (new and recurrent). Severity categories can be filtered by clicking the severity legend at the bottom.
Additional charts
The AppSec tab supports up to 14 active charts simultaneously. Beyond the default set above, the following charts are also available:
- Closed Vulnerabilities: a comparison graph showing the number of closed vulnerabilities across projects, products, business units, or teams within a selected period (last 90 days).
- Industry Standards: shows the distribution of all vulnerabilities by OWASP Top 10, PCI, and NIST categories. Closed vulnerabilities can be included or excluded via the legend.
- Issue Trend: shows the evolution of issue tracker ticket statuses (open, in progress, closed) over time, broken down by severity.
- New Vulnerabilities: a comparison graph showing newly discovered vulnerabilities as increases and closed vulnerabilities as decreases on the Y-axis, for a selected period (last 90 days).
- New vs. Closed Trend: shows the number of new and closed vulnerabilities within a selected period (last 90 days). Weeks are treated as calendar weeks (Mon to Sun).
- Recurrent Vulnerabilities: a comparison graph showing the number of recurrent vulnerabilities (discovered two or more times) across projects, products, business units, or teams for a selected period (last 90 days).
- Risk Score Trend: shows the evolution of the average risk score over time.
- Severity Snapshot by Team: shows the number of new and recurrent vulnerabilities in projects assigned to selected teams, broken down by severity.
- Severity Trend: shows the evolution of the total number of new and recurrent findings under each severity category over time.
- Suppressed Vulnerabilities Expiring in a Week: shows the number of vulnerabilities marked as false positive, won't fix, or mitigated with an expiration date in the next seven days, broken down by severity.
- Vulnerability Density: shows the frequency of the top 25 vulnerabilities regardless of status. Circle size indicates how often a vulnerability was discovered. Can be viewed by CWE ID, endpoint, or file/path.
- WOE by Severity: shows the distribution of new and recurrent vulnerabilities by their aging and severity. Includes a WOE Top Ten tab showing the ten vulnerabilities with the highest Window of Exposure.
API insights tab
The API Insights tab provides comprehensive API security metrics through a top row of five summary cards, followed by detailed analysis sections.
API summary metrics
The top section displays key API metrics in five summary cards:
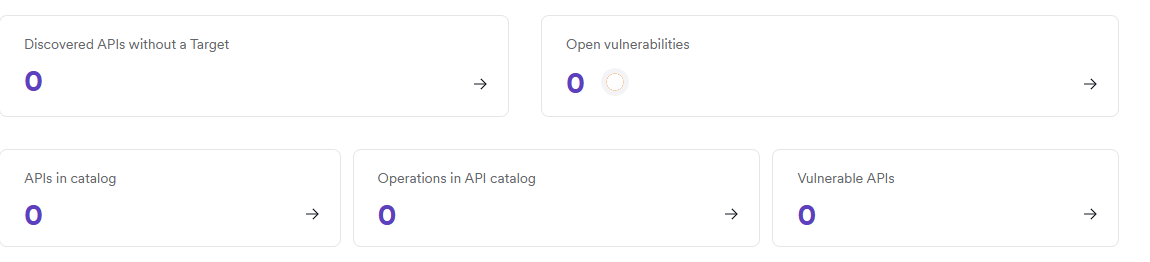
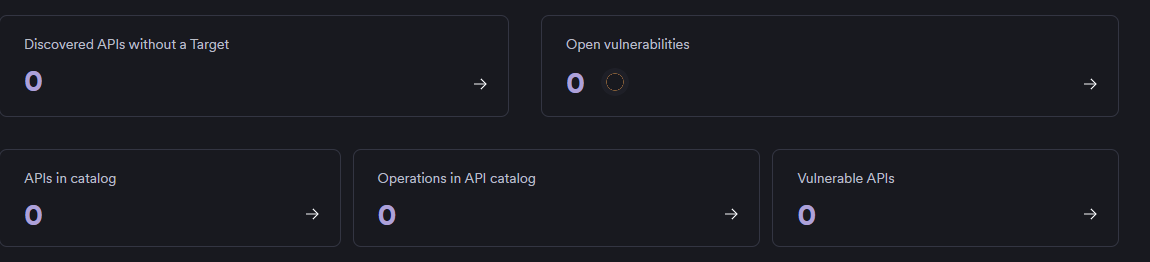
- Discovered APIs without a Target: APIs found but not configured for scanning
- APIs in catalog: Total catalogued APIs in your system
- Operations in API catalog: Total API operations/endpoints across all APIs
- Vulnerable APIs: Number of APIs with identified vulnerabilities
- Open vulnerabilities: Current count of unresolved API vulnerabilities
Detailed analysis sections
Below the summary cards, the tab provides four detailed analysis sections:
Open API vulnerabilities
Displays the current count of unresolved vulnerabilities with a detailed breakdown by severity levels in a table format. Includes a Vulnerabilities by severity table showing Critical, High, Medium, Low, and Informational vulnerabilities along with their Mean Time To Remediate (MTTR) values.
Most recent discovered APIs
Shows a table of the latest APIs discovered in your environment, including the API name, base URL, and discovery timestamp. This helps track new API additions and ensures newly discovered APIs are properly secured and monitored.
Most vulnerable APIs
Lists the APIs with the highest vulnerability counts, allowing you to prioritize remediation efforts on the most at-risk components of your API infrastructure. When no vulnerable APIs exist, displays guidance on adding API sources.
Average vulnerabilities per API
Presents a chart showing vulnerability trends over time, providing insight into overall API security quality and helping assess the security maturity of your API development practices.
Need help?
Invicti Support team is ready to provide you with technical help. Go to Help Center