Deployment: Invicti Platform on-demand, Invicti Platform on-premises
Trend Matrix
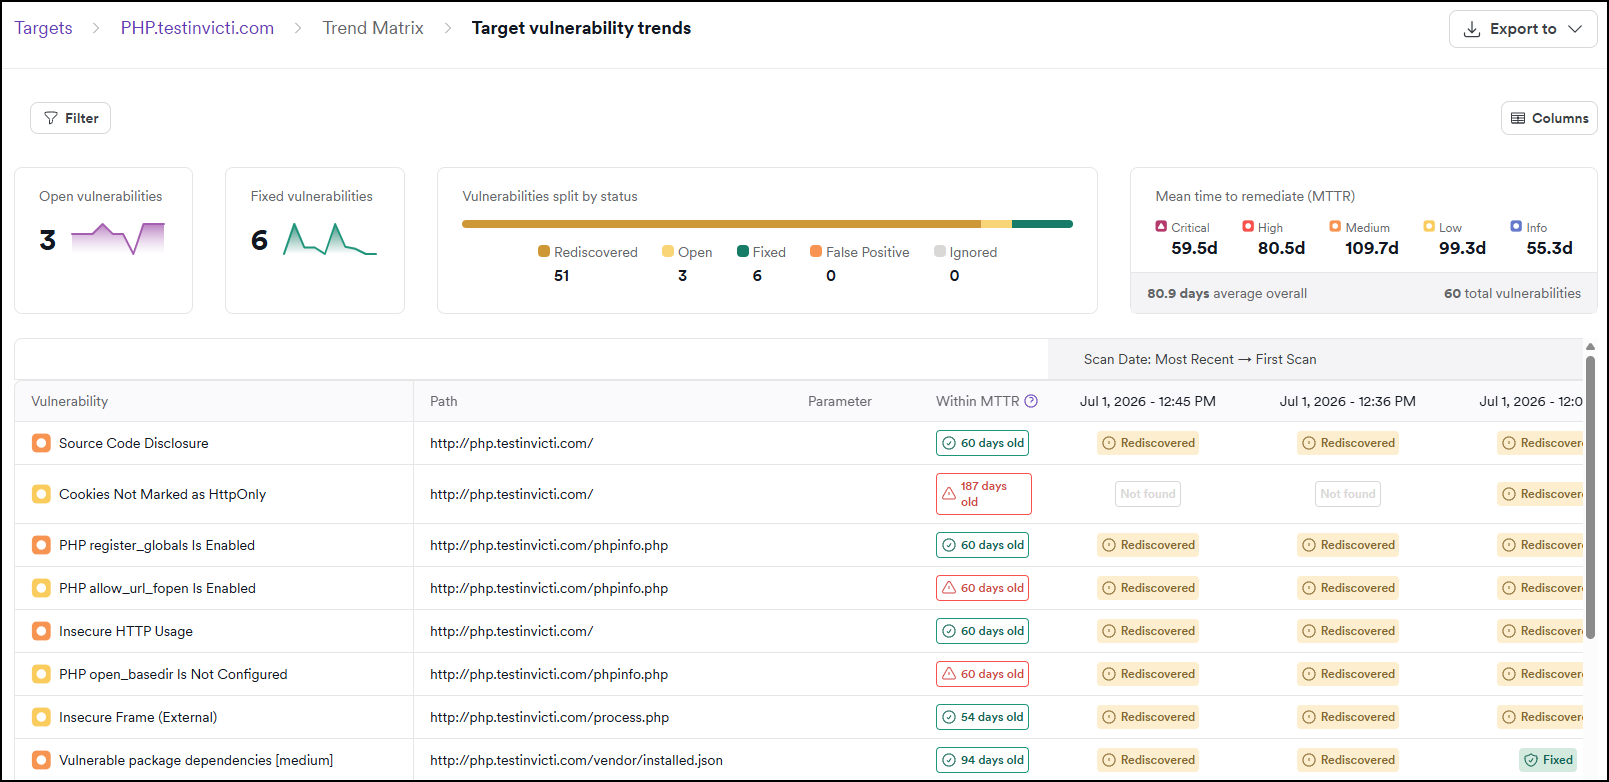
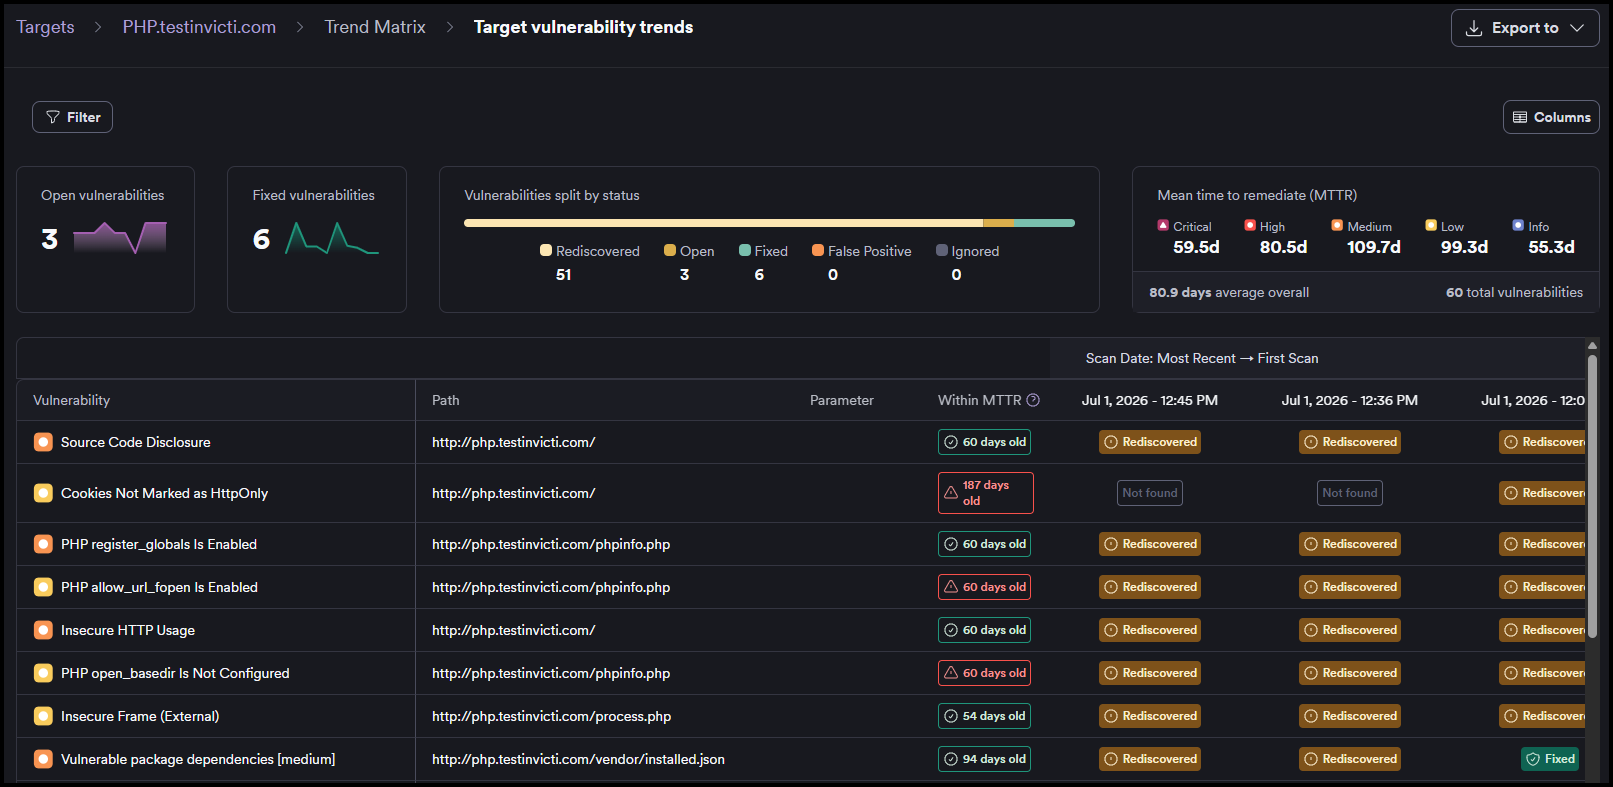
The Trend Matrix is a standalone page in Invicti Platform that shows how vulnerabilities have progressed across scans for a specific target, application, or collection. Each row represents a vulnerability, and each column represents a scan date. The cell at their intersection shows the vulnerability's status at that point in time.
This document explains how to access and use the Trend Matrix.
Why this matters
Knowing a vulnerability exists is only the first step. Understanding how long it's been open, whether it's been fixed or rediscovered, and whether it's within the expected remediation window is what drives effective risk management. The Trend Matrix shows the full lifecycle of each vulnerability across every scan, so you can identify what's stalled, what's exceeded its mean time to remediate (MTTR) threshold, and what may be a recurring problem. Rediscovered vulnerabilities - ones that were fixed but reappeared in a later scan - often signal an underlying issue that a one-time fix didn't resolve.
Open the Trend Matrix
You can open the Trend Matrix from four places in Invicti Platform.
From a target
- Select Inventory > Targets from the left-side menu.
- Click a target row to open the target drawer.
- In the Risk level section of the Overview tab, select View trend matrix.
From an application
- Select Inventory > Applications from the left-side menu.
- Click an application to open its dashboard.
- In the Vulnerability trend over time section, select View trend matrix.
View trend matrix is available only after the application has at least one completed scan.
From a collection
- Select Inventory > Collections from the left-side menu.
- Click a collection to open its dashboard.
- In the Vulnerability trend over time section, select View trend matrix.
View trend matrix is available only after the collection has at least one completed scan.
From the API catalog
- Select Inventory > API catalog from the left-side menu.
- Click an API row to open the API details drawer.
- In the drawer, select to open the Trend Matrix for the target associated with that API.
Overview
The Trend Matrix page has two main areas: a summary panel at the top and a vulnerability table below.
Summary panel
The summary panel displays four metrics:
- Open vulnerabilities - the total number of currently open vulnerabilities.
- Fixed vulnerabilities - the total number of fixed vulnerabilities.
- Vulnerabilities split by status - a bar showing the distribution of all vulnerabilities across statuses.
- Mean time to remediate (MTTR) - the average number of days to remediate vulnerabilities, shown per severity level (Critical, High, Medium, Low, Informational) and as an overall average.
Vulnerability table
Each row represents a detected vulnerability. The following columns are always visible:
- Vulnerability - the severity icon and vulnerability name.
- Within MTTR - whether the vulnerability is within its expected remediation window for its severity. A green badge means it's within the threshold; a red badge means it has exceeded it. Both badges also show how many days old the vulnerability is.
You can toggle these additional columns on or off using the column selector:
- Source - the source of the vulnerability. Available on application and collection views only.
- Path - the URL path where the vulnerability was found.
- Parameter - the affected parameter.
To the right of the fixed columns, date columns appear - one per scan. Each cell in a date column shows the vulnerability's status at that scan.
Vulnerability status indicators
Each cell in a date column shows a status badge:
| Status | Description |
|---|---|
| Open | The vulnerability was detected and is currently open. |
| Fixed | The vulnerability was confirmed as fixed. |
| Fixed (unconfirmed) | The vulnerability wasn't found in the latest scan but hasn't been confirmed as fixed. |
| Rediscovered | The vulnerability was previously fixed but reappeared in a later scan. |
| False positive | The vulnerability was marked as a false positive. |
| Ignored | The vulnerability is being tracked but ignored. |
| Not checked | The vulnerability wasn't checked in this scan. |
| Not found | No data exists for this vulnerability at this scan date. |
Filter the Trend Matrix
Use the filter bar above the table to narrow down the vulnerability list. The following filters are available on all views:
- Vulnerability - filter by vulnerability name.
- URL - filter by URL.
- Parameter - filter by parameter.
- Assignee - filter by the person assigned to the vulnerability.
- Status - filter by vulnerability status.
- Severity - filter by severity level.
- Within MTTR - show only vulnerabilities within or beyond their MTTR.
- Timestamp - filter by when the status change occurred.
On application and collection views, two additional filters are available:
- Asset name - filter by the name of the associated asset.
- Environment - filter by the asset's environment.
Time range (application and collection views only)
On application and collection views, use the View by selector to set the time range for the date columns:
- Last year - shows one column per month.
- Last quarter - shows one column per week.
- 30 days - shows one column per day.
View vulnerability details
Click any vulnerability row to open the vulnerability detail panel on the right side of the page. The panel shows the full vulnerability record, including proof of exploit, request and response data, and activity. You can also create issue tracker tickets directly from the panel.
Use the navigation arrows at the top of the panel to move between vulnerabilities without closing it. The selected vulnerability's ID is saved in the page URL, so you can share a direct link to any row.
Export the Trend Matrix
- Click Export to in the top-right corner of the page.
- Select a format from the dropdown: CSV, JSON, or XML.
Invicti applies your current filter state to the export. A confirmation notification appears when the export is ready.
Troubleshooting
The Trend Matrix fails to load
If the page shows "Loading the trend matrix failed...", click Retry to reload the data. If the error persists, check your network connection and refresh the page.
No vulnerabilities appear in the table
If no filters are active and the table is empty, the target, application, or collection hasn't returned any vulnerabilities yet. Run a scan first, then return to the Trend Matrix.
If filters are active, adjust or clear them to see existing data.
Need help?
Invicti Support team is ready to provide you with technical help. Go to Help Center