Package: Invicti AppSec Core (on-demand)
Project dashboard
The project dashboard provides a project-level view of vulnerabilities and security metrics. By default, the dashboard displays data based on vulnerabilities found in the default branch. Use the drop down to pick an alternate branch to view its data instead.
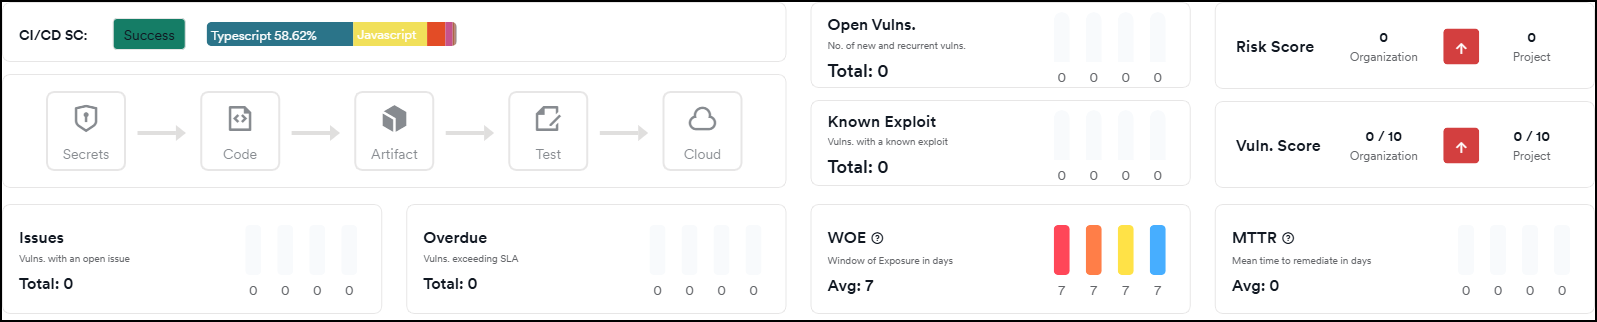
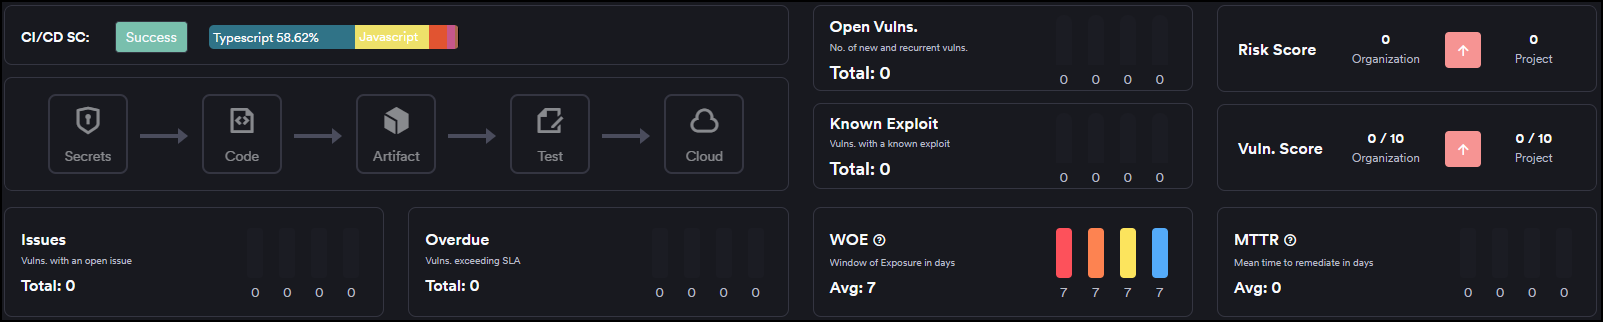
Key metrics
The dashboard displays the following metrics:
- Risk Score: Calculated based on the total number of new and recurrent vulnerabilities. The organizational risk score reflects the average across all projects.
- Issues: The total count of newly discovered and recurring vulnerabilities with assigned issues that remain open, organized by severity level.
- Overdue: Displays vulnerabilities that have exceeded their SLA thresholds.
- WOE (Window of Exposure): Shows the average time elapsed since vulnerabilities were discovered, segmented by severity.
- MTF (Mean Time to Fix): The average closure time for resolved vulnerabilities, broken down by severity.
Charts
All charts available on the organizational dashboard are also available at the project level.
Branch comparison
The branch comparison chart places scanned branches on the X-axis with vulnerability severities on the Y-axis. You can use the dropdown to filter by scanner type.
Scanner comparison
The scanner comparison chart positions individual scanners on the X-axis against vulnerability severities on the Y-axis. You can use the dropdown to filter by scanner.
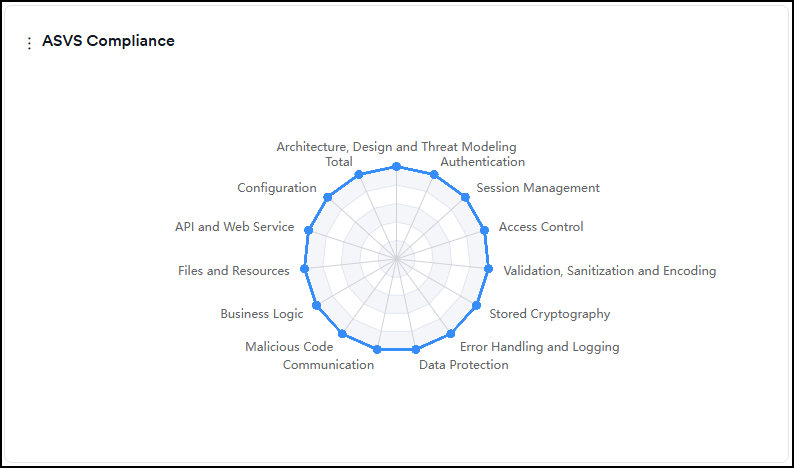
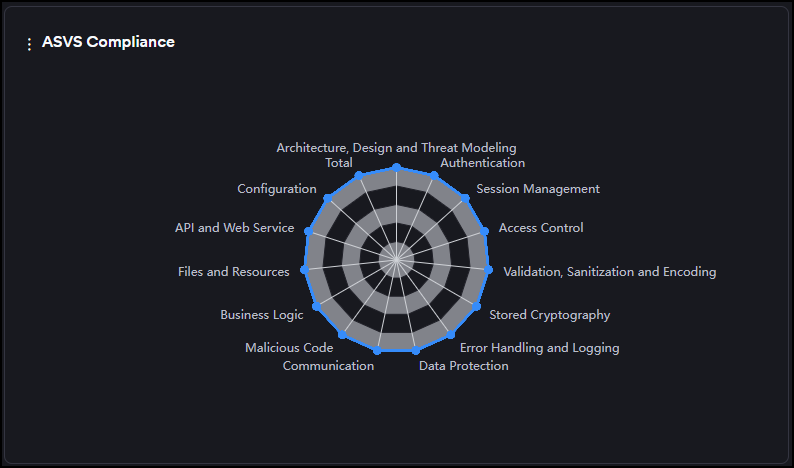
ASVS compliance
The ASVS compliance chart displays the ratio of met ASVS criteria per category relative to the total required criteria. The required criteria are determined by the project's business criticality level.
Need help?
Invicti Support team is ready to provide you with technical help. Go to Help Center