Deployment: Invicti Platform on-demand
Review agentic pentest results
Previous: Create an agentic pentest | Next: Manage agentic pentests
This document explains how to monitor a running assessment, review the findings and agent traces, explore the crawled site structure, and download the pentest report.
Why this matters
Reviewing results as the assessment runs - not just after it completes - helps you understand the reasoning behind potential vulnerabilities as they are discovered. The agent trace shows the evidence and attack chain; final validation determines whether a finding is a true positive or false positive. Downloading the report gives you a shareable record that reads like a traditional manual pentest report, ready to attach to a ticket or share with stakeholders.
Overview
The agentic pentest view is organized into four tabs: Summary, Agent monitoring, Vulnerabilities, and Site structure. Each tab covers a different aspect of the assessment results.
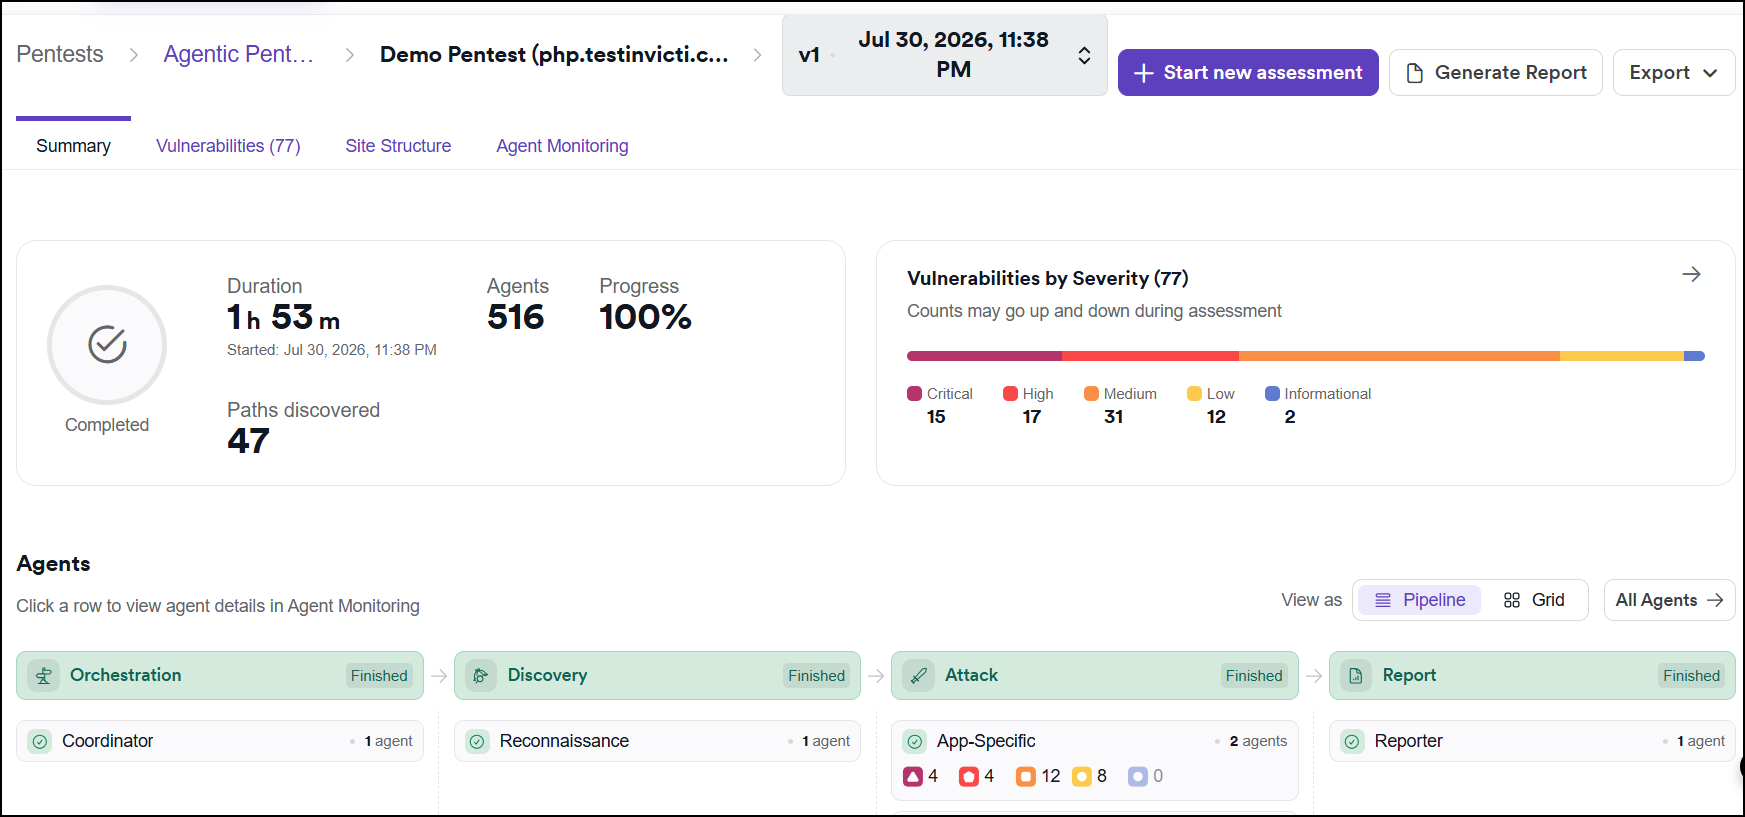
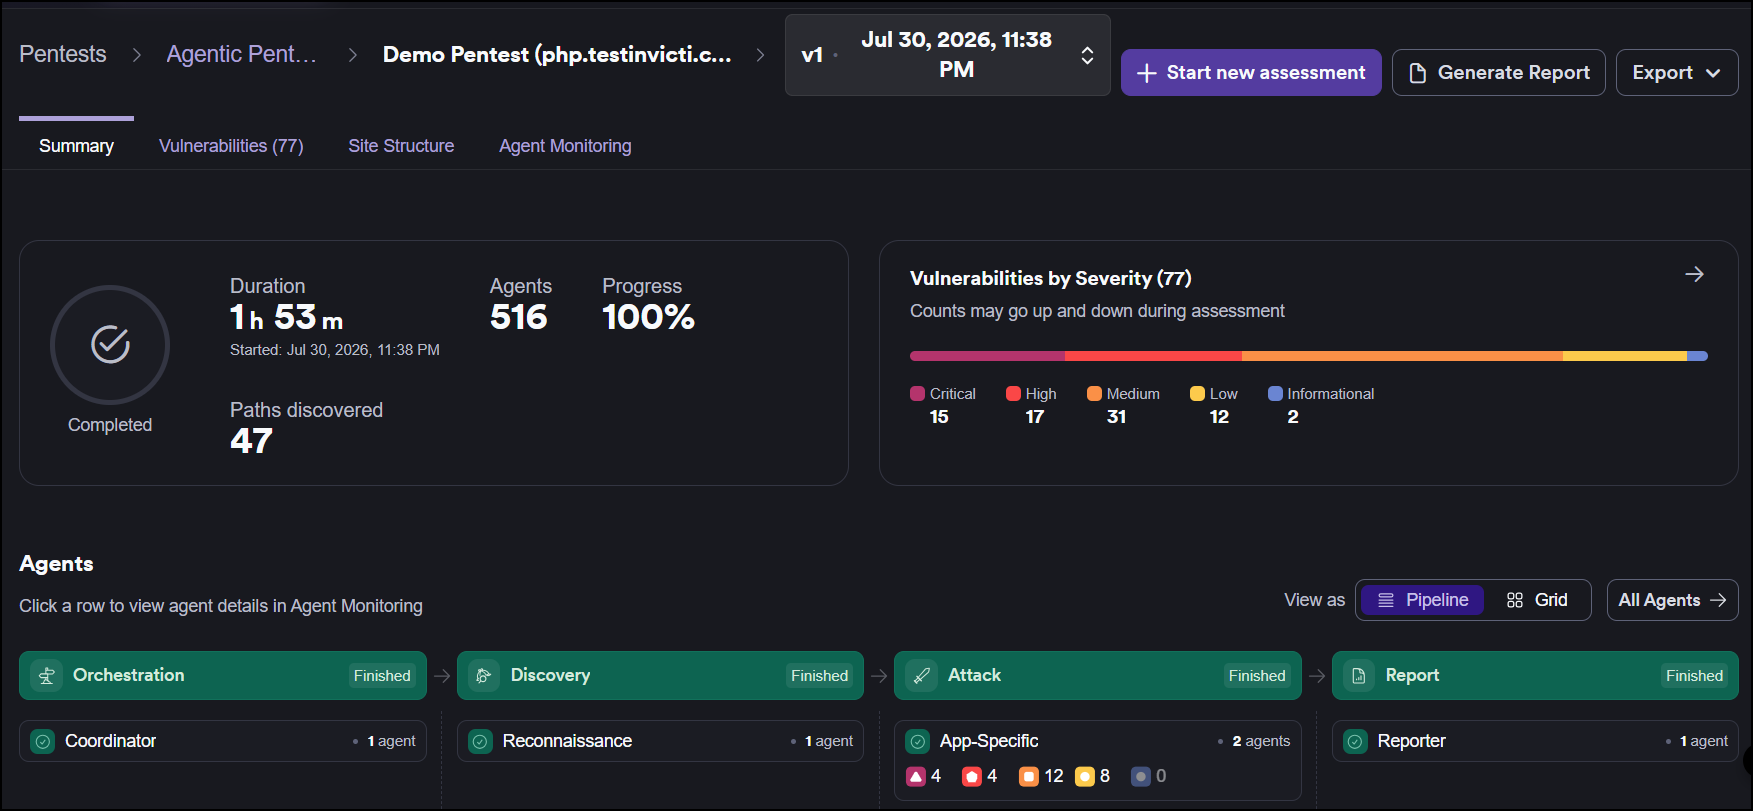
The breadcrumb at the top shows the pentest name and the current assessment version. Use the version dropdown to switch between versions and compare results over time.


Action buttons in the top right depend on the assessment status:
- While running: Stop Assessment is available; Generate Report and Export are inactive.
- After completion: + Start new assessment, Generate Report, and Export are all active.


Summary tab
The Summary tab opens by default when you navigate to a pentest. It gives you a live view while the assessment runs and remains the primary record after it completes.
Monitor progress
- Select Pentests from the left-side menu.
- Click the pentest from the list. It opens on the Summary tab. When the assessment is running, a banner at the top confirms it's active and that findings update as it runs.
The Summary tab shows the headline view: overall status and progress, how long the assessment has been running, the number of paths discovered, the number of active agents, and a vulnerability count broken down by severity.
Severity counts move up and down while the assessment is running - treat them as a live picture, not a final tally.
Warning banners in the status area surface issues the assessment detected - for example, that a web application firewall (WAF) is protecting the target. These are informational and don't stop the assessment.
- Scroll down to the Agents view to see how Octo organizes the work. The assessment moves through four stages in sequence:
| Stage | What it does |
|---|---|
| Orchestration | Coordinates the whole assessment and spawns the Discovery stage |
| Discovery | Pairs a reconnaissance agent with a conventional crawler to map the application and identify the paths, parameters, and methods worth testing |
| Attack | Runs the bulk of the testing. Octo groups attacks by agent type and spins up one agent instance per combination of path, parameter, and method. It's normal to see a large number of instances under one type - for example, 22 agents under OS Command Injection simply means that agent found 22 distinct things to test. |
| Report | Runs after the attack agents finish. A reporter agent analyzes all findings, sorts signal from noise, and assembles the results. |
- Switch the Agents view between Pipeline and Grid to choose how you prefer to see progress.
- Click any row to go to the Agent monitoring tab for a closer look at that agent class.


Scroll past the Agents view to the Assessment information panel for a full record of the run: pentest name, status, target URL, authentication method, start and end times, owner, the agents that ran, and any uploaded files.
Stop an assessment
To stop a running assessment before it completes:
- Select Pentests from the left-side menu.
- Open the running pentest from the list.
- Click Stop Assessment in the top right.
- In the Stop this assessment? dialog, click Stop assessment. (Click Go back to cancel.)
The assessment completes the Report stage on whatever findings exist so far, then moves to Completed. A banner remains on the Summary tab: "This assessment was stopped by a user before completing. Results are based on findings up to that point."
After the assessment completes, Stop Assessment is replaced by + Start new assessment and Generate Report becomes active.
Agent monitoring
The Agent monitoring tab gives you a detailed view of what each agent did and how it reached its conclusions.
- Select Pentests from the left-side menu.
- Open the pentest from the list.
- Select the Agent monitoring tab.
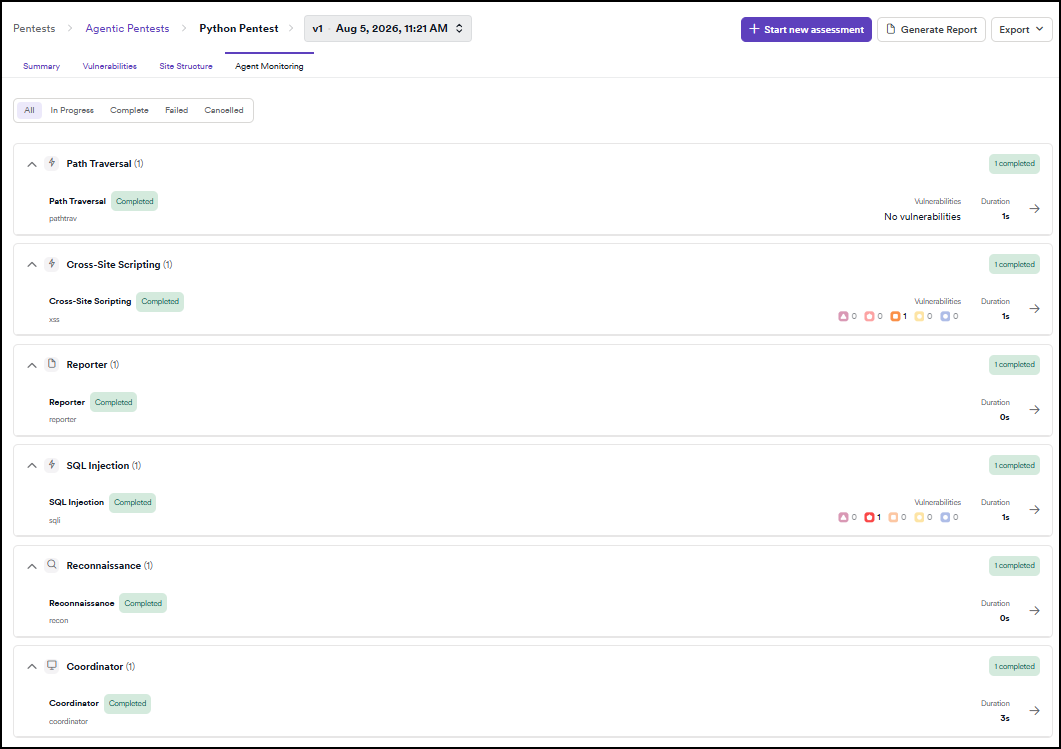
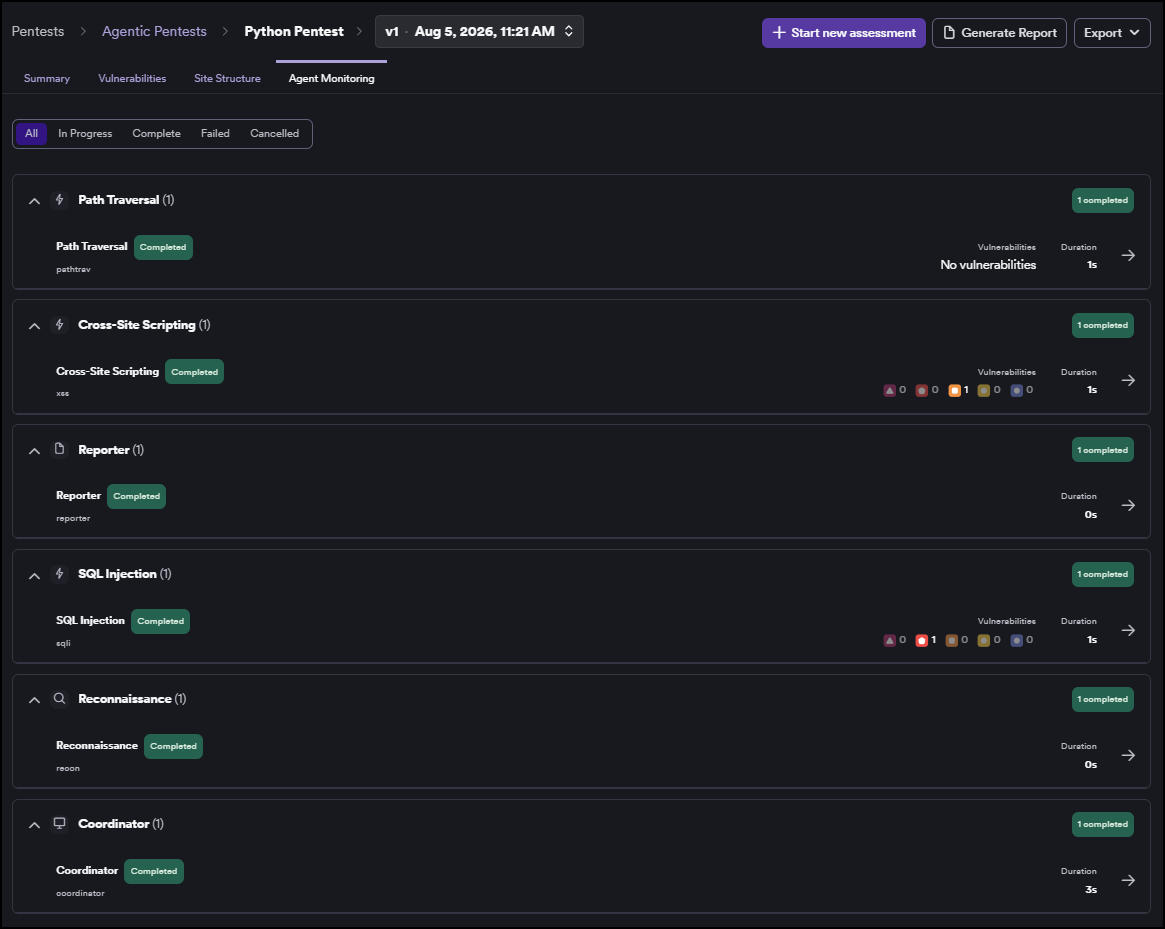
- Use the status filter at the top to show agents by All, In progress, Complete, Failed, or Cancelled.
- Expand an agent class to see its individual instances. Each instance shows the target it was assigned along with how long it ran.
- Click the arrow (→) on an instance row to open its Agent Trace. The trace shows:
- The agent's duration and number of trace events.
- Octo's thoughts - a timestamped log of the agent's chain of reasoning as it worked through the target.
- The Vulnerabilities confirmed by that instance, with the affected URL and parameter. Click a finding to jump to its matching trace entry.
Review vulnerabilities
The Vulnerabilities tab brings all findings together in a prioritized list. The list refreshes automatically while the assessment is active - new findings appear without a page refresh.
- Select Pentests from the left-side menu.
- Open the pentest from the list.
- Select the Vulnerabilities tab. The total finding count and a severity breakdown appear at the top. The table lists each finding with its source, severity, title, affected endpoint, parameter, validation status, and the time it was found. Each finding has a source badge: OCTO for findings the AI agents produced, DAST for findings from the conventional crawler.
- Use the Filter button to filter by source, validation status, or severity. Sort any column, or click Reset filters to start over. Two validation statuses to know:
- Verified - the agent confirmed the finding with evidence.
- Inconclusive - needs a human reviewer to decide.
- Click a vulnerability to open the detail pane and review the evidence:
- Details - shows the affected endpoint and parameter.
- View traces - links back to the agent trace that produced the finding.
- Attack details - shows the exact payload used and the evidence that proved the issue. For example, the payload
directory=.;nslookupand an out-of-band DNS callback as proof the injection fired. - Remediation - specific, actionable guidance on how to fix the issue.
- Request / Response - the raw HTTP exchange for the finding.
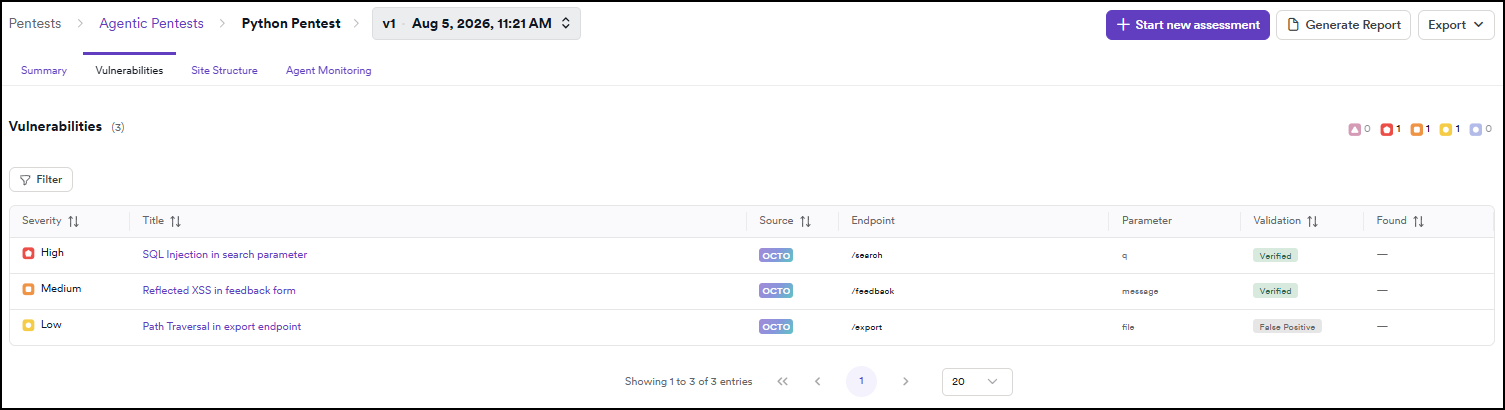
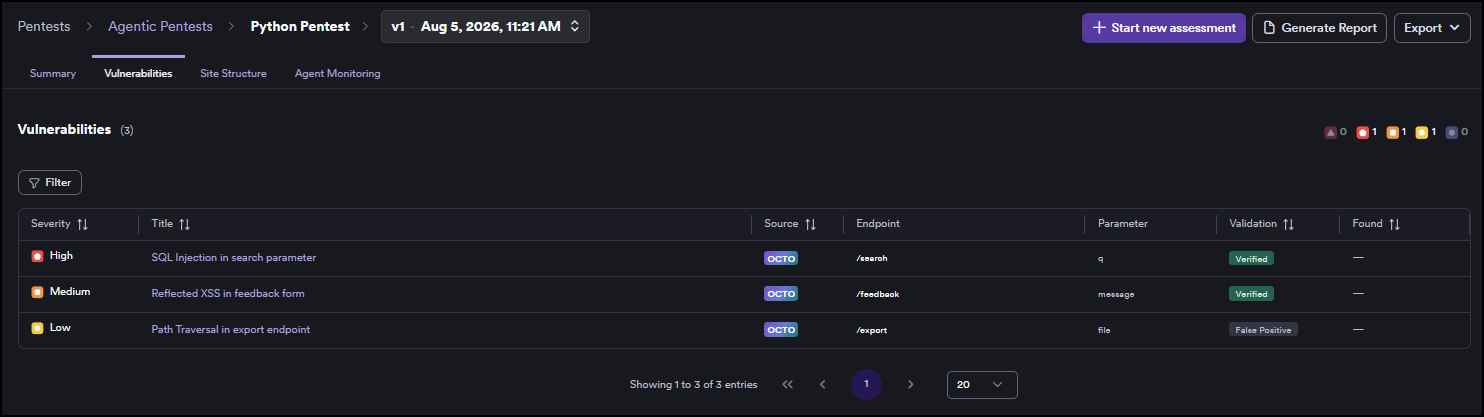
Pentest findings also appear in the main Vulnerabilities view, alongside findings from DAST scans, where you can triage, assign, and manage them across your organization.
View site structure
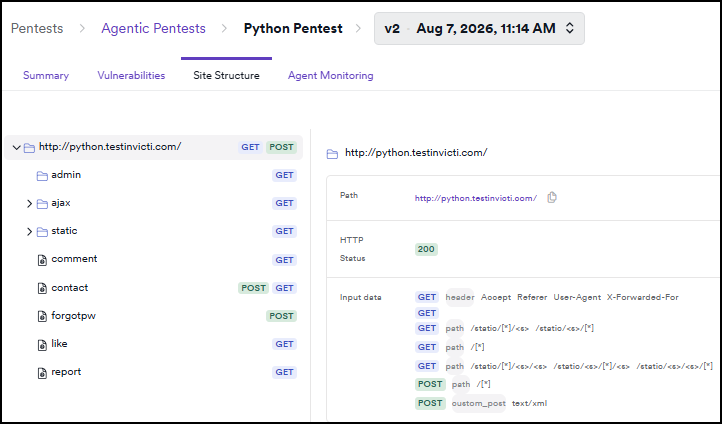
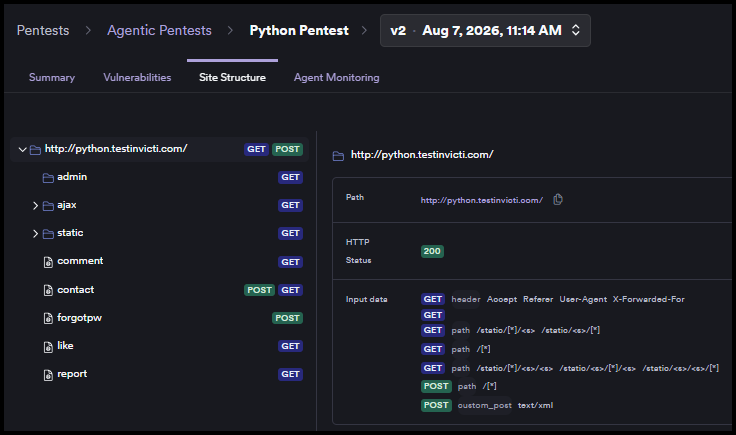
The Site structure tab shows the application's crawled URL tree, organized by folder. Use it to evaluate what the crawler discovered and how thoroughly it covered your application's attack surface.
- Select Pentests from the left-side menu.
- Open the pentest from the list.
- Open the Site structure tab.
- Browse the tree to explore discovered paths. Each entry shows the HTTP methods used for that path.
- Click a path to select it and see its details in the panel on the right: the full URL (with a copy button), the HTTP status code, and the input parameters the crawler found.
The tab updates automatically while the assessment is running - the Discovery stage adds paths as it finds them.
Download and export
- PDF report
- CSV sitemap
Octo generates a PDF report you can share with stakeholders, attach to a ticket, or keep for your records.
- Select Pentests from the left-side menu.
- Open any completed assessment from the list.
- Click Generate Report in the top right to start generating the PDF report.
- Once the report is ready, click Download Report to save the PDF.
If generation fails, the button label changes to Retry Report and an error message appears in the actions bar. Click Retry Report to try again.
The report moves from the big picture down to the specifics:
| Section | What it contains |
|---|---|
| Cover page | Target and assessment date |
| Executive summary | Severity counts and a plain-language account of what the assessment found and why it matters |
| Scope and methodology | Target, start and completion times, and the reconnaissance and attack approach used for each vulnerability class |
| Attack surface analysis | Technologies detected, entry points discovered, and notable exposures |
| OWASP Top 10 2025 coverage | Findings mapped to the current OWASP categories |
| Vulnerabilities overview | A table of every finding with its severity, status, type, and title |
| Detailed vulnerabilities | Per-issue write-ups with severity, CWE score, CVSS score, affected endpoint and parameters, payloads used, evidence, the full HTTP request and response, steps to reproduce, and remediation guidance |
The CSV sitemap exports every URL the crawler discovered during the assessment, together with its input parameters. Use it to review attack surface coverage or import the data into another tool.
- Select Pentests from the left-side menu.
- Open any completed or cancelled assessment from the list.
- Click Export in the top right and select CSV sitemap.
The CSV contains four columns:
| Column | What it contains |
|---|---|
| Name | The endpoint or resource name (for example, comment, contact) |
| URL | The relative path |
| FullURL | The absolute URL |
| Inputs (Name:Type) | Every input parameter the crawler found, with its type: query, header, multipart, url_encoded_post, path, xml, or custom_post |
| Agents | The agent types that tested this endpoint, listed as quoted names separated by semicolons (for example, "App-Specific"; "SQL Injection"). Empty when no agents tested the path. |
Troubleshooting
The assessment completed but found no endpoints
A banner appears: "The crawler found no endpoints to assess. Verify the target URL and authentication configuration."
Check that the target URL is correct and accessible. If the application requires authentication, confirm the credentials are valid - without them, the crawler can only reach publicly accessible pages, which may result in an empty crawl if most content is behind a login.
The target was unreachable
A banner appears: "The target was unreachable at the time of the assessment. Verify connectivity and try again."
Confirm the target URL is correct and that the application is running. If you're testing an internal application, confirm the assessment can reach it. Start a new assessment once the connectivity issue is resolved.
The assessment has been running for a long time with no progress
Assessments can run for up to 24 hours depending on the size of the attack surface. Check the Agent monitoring tab to see whether agents are still active. If agents show as in progress, the assessment is still running.
If all agents show as Complete or Failed but the assessment status hasn't updated, contact Invicti Support and share the pentest name and target URL.
The assessment failed or was interrupted
A banner on the Summary tab describes the failure reason. Common causes:
- Interrupted unexpectedly - the assessment encountered an unrecoverable error. Start a new assessment to retry.
- Exceeded maximum duration - partial results are available. Review what was found, then start a new assessment to cover the remaining attack surface.
- Organization quota exceeded - the assessment was stopped because your organization reached its quota. Contact sales to increase your limit.
If the banner text doesn't describe the cause, open the Agent monitoring tab for more detail on which agents failed and why.
The source code couldn't be processed
A banner appears: "The source code could not be extracted from the uploaded file. Verify the upload and try again."
Confirm the archive is a valid .zip, .tar, .tgz, .tar.bz2, or .tar.xz file and isn't corrupted. Create a new pentest and upload the archive again in Step 3.
The report hasn't appeared after the assessment completed
Report generation starts when you click Generate Report - it doesn't start automatically. If the button is unavailable after a few minutes, refresh the page.
If generation starts but fails, the button changes to Retry Report. Click it to try again. If the problem persists, contact Invicti Support and share the pentest name.
Next steps
→ Continue to Manage agentic pentests
Agentic pentests series
- Agentic pentests
- Create an agentic pentest
- Review agentic pentest results ← You are here
- Manage agentic pentests
Need help?
Invicti Support team is ready to provide you with technical help. Go to Help Center