Targets dashboard in Invicti Enterprise
The Targets Dashboard provides access to the latest scan information for individual targets, both during and after completion of a scan. Additionally, you can review previous scan results conducted under various configurations, including those utilizing identical Scan Policies and Scan Settings. This document explains the information available to view on the Targets Dashboard.
View the targets dashboard
The targets dashboard can be accessed by following these steps:
- In Invicti Enterprise, select Targets > Targets from the left-side menu.
- Click on the Name of a target to open its dashboard.
- Optionally, switch from the default view to a customized view according to your preference.
Default view
The default view shows information about all scan groups. The information is grouped and displayed on interactive widgets. Each of these widgets is explained in the sections below.
Customized view
Using the drop-down, you can filter the displayed information by:
- All Scan Groups: Shows scan information for all scan groups.
- A specific Scan Group: Shows scan information for the selected combination of Scan Policy and Report Policy.
The information displayed on the dashboard updates as soon as you select a customized view.
Targets dashboard widgets
The targets dashboard contains many widgets that display graphs and tables pertaining to your scan results. Read on for more details.
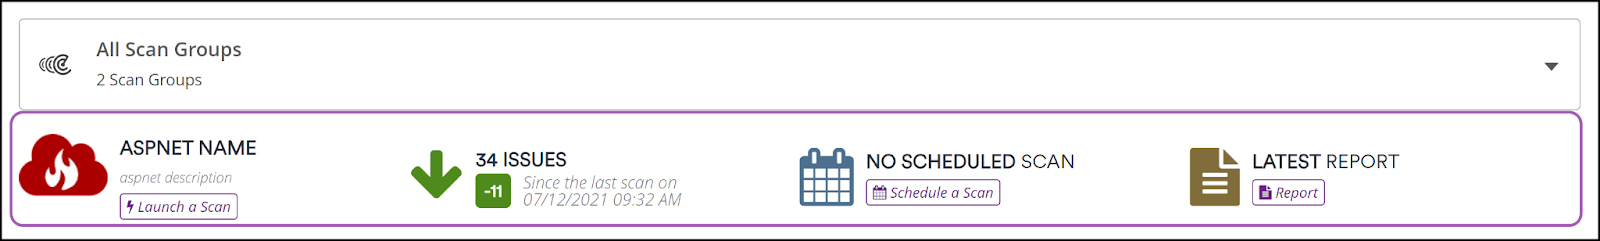
Top panel
The top panel of the dashboard showcases the following widgets:
- Target Name: Displays the name of the target with a Launch a Scan button.
- Issues Counter: Shows the number of issues detected since the last scan and indicates the variance.
- Next Scan: Provides the date and time of the next scheduled scan, or a Schedule a scan button if no scans are scheduled.
- Latest Report: The Report button takes you to the Scan summary page to explore the Technical report.
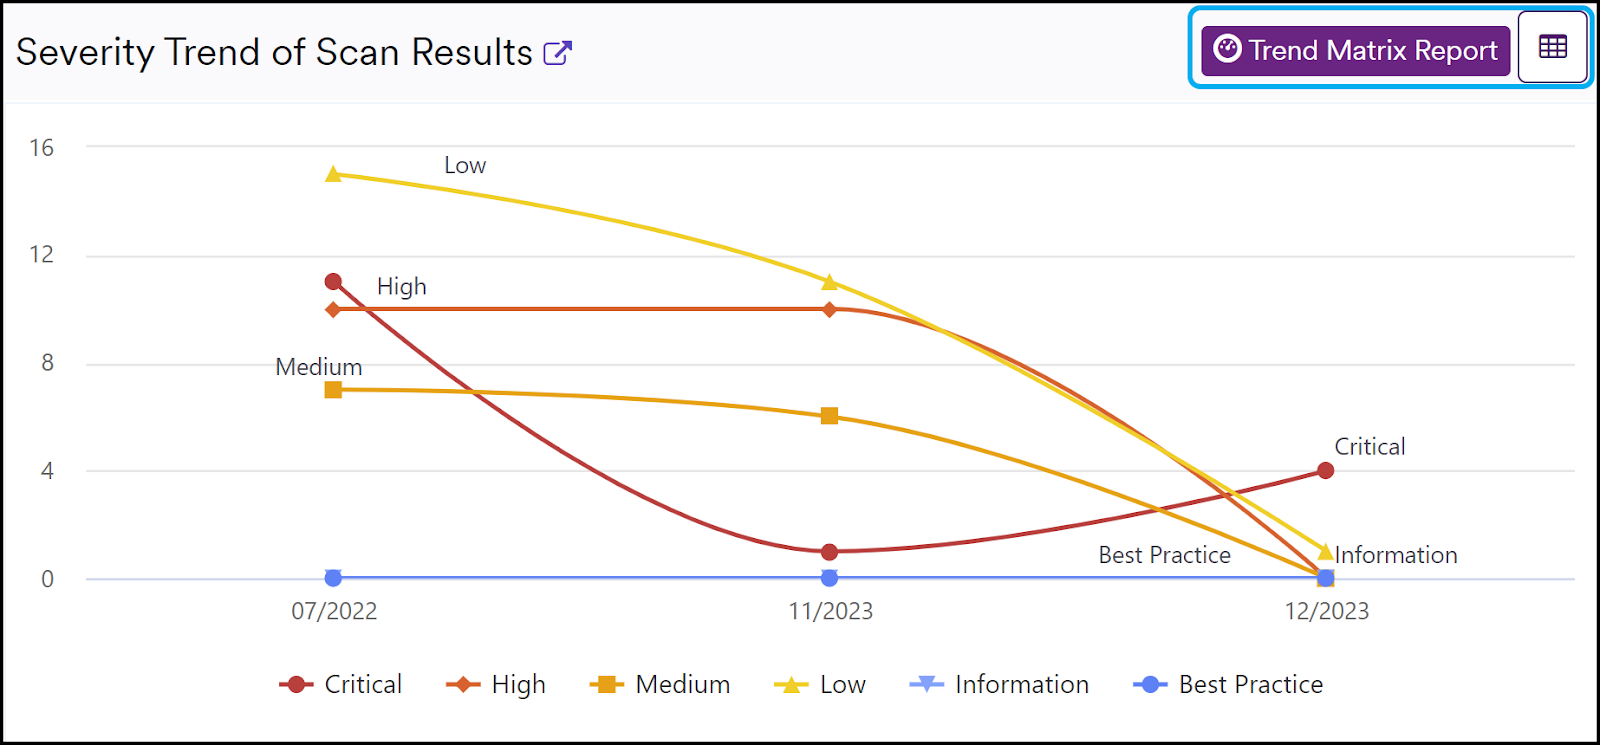
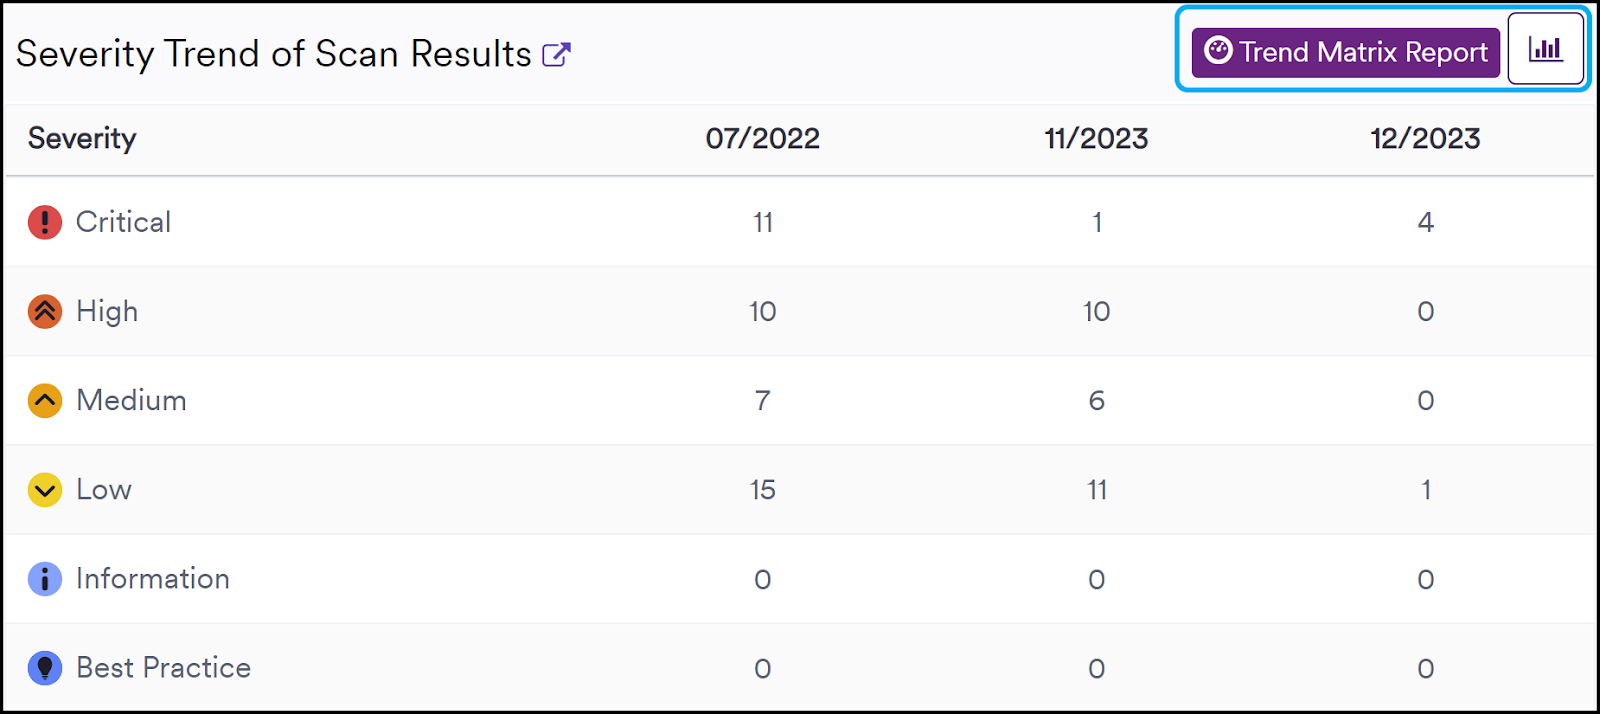
Severity trend of scan results
This widget visualizes issues grouped by vulnerability severity level, allowing you to compare counts and view changes over time.
Click the Trend Matrix Report (Severity Trend Report) for a more comprehensive overview. This report is generated only if multiple scans have been run. Use the icon in the top-right corner to toggle between table and chart view.
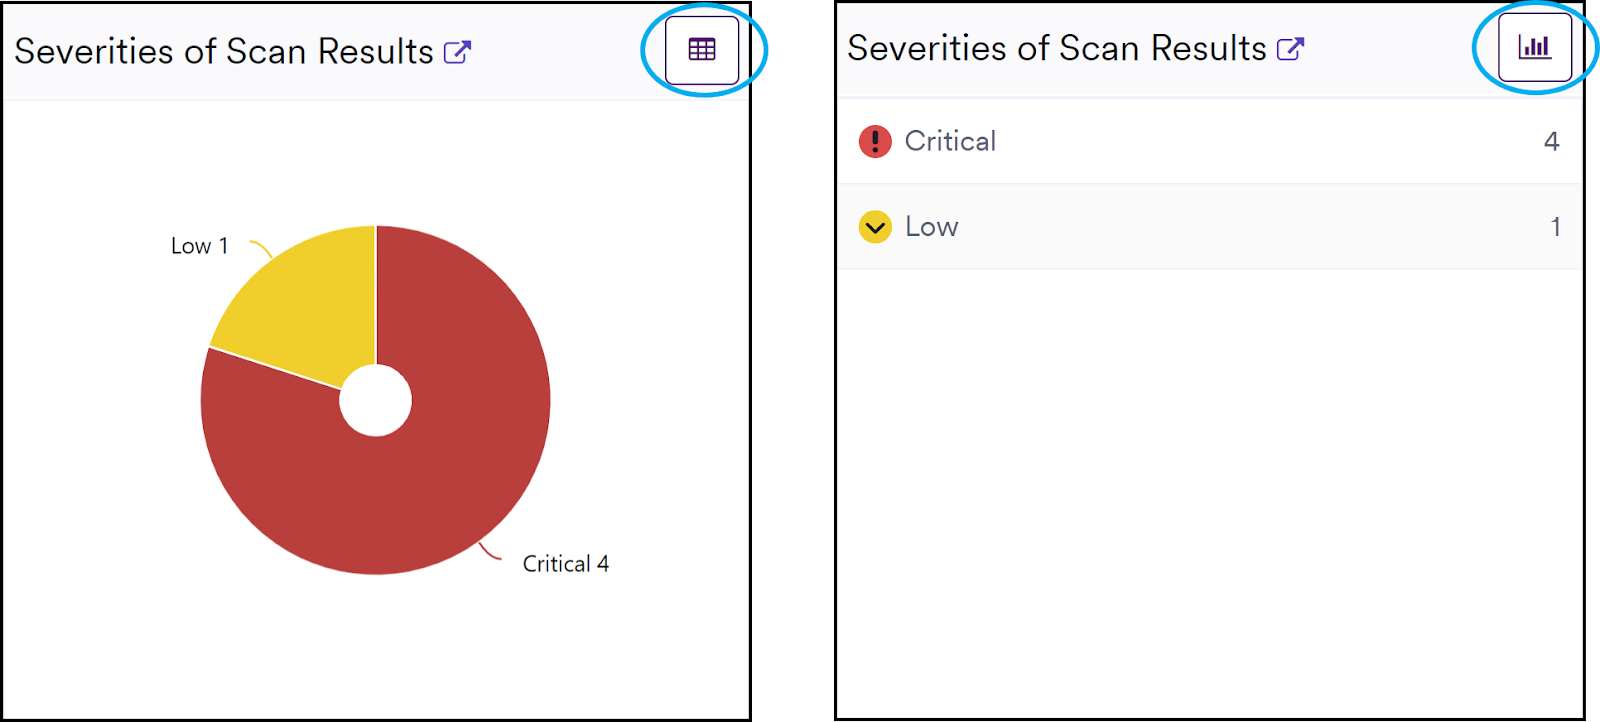
Severities of scan results
Displays a pie chart showing each severity category along with its count. The values match the last column of the Severity Trend widget above.
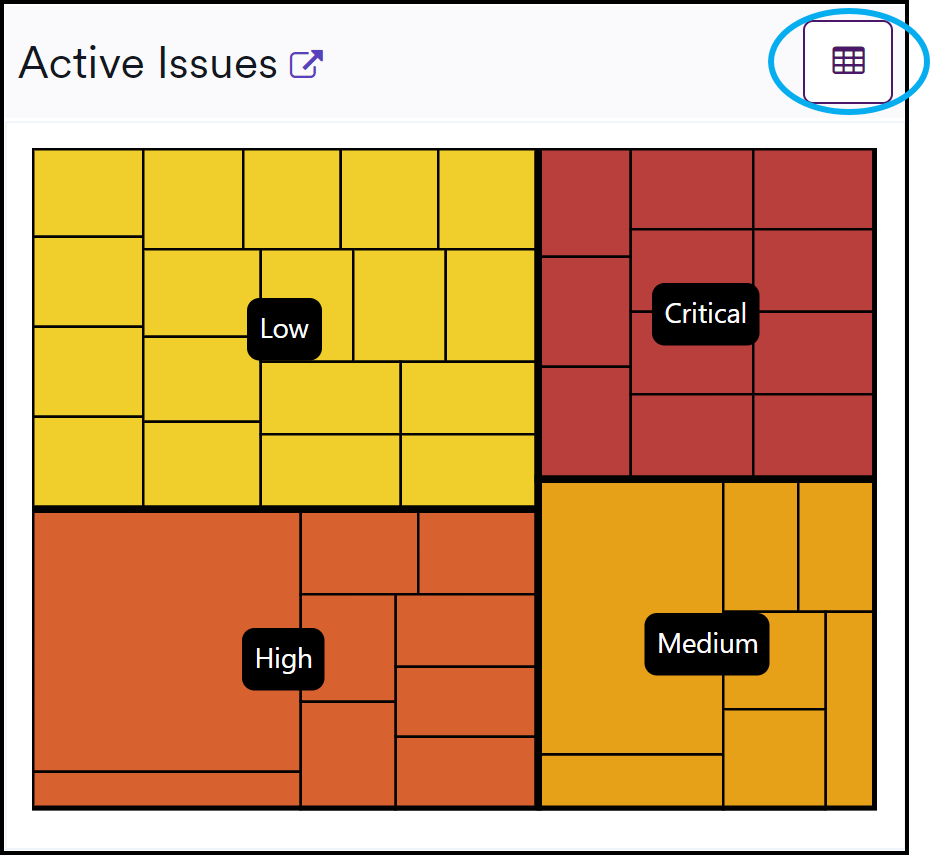
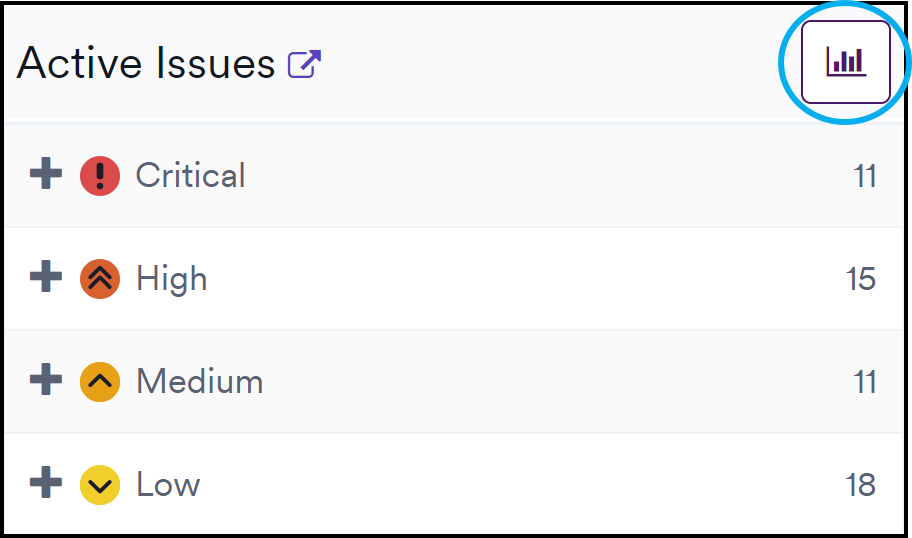
Active issues
A treemap representation of active issues, allowing you to drill down for more details. Total count matches the Active Issues in the top panel. Use the top-right icon to switch between chart and table view.
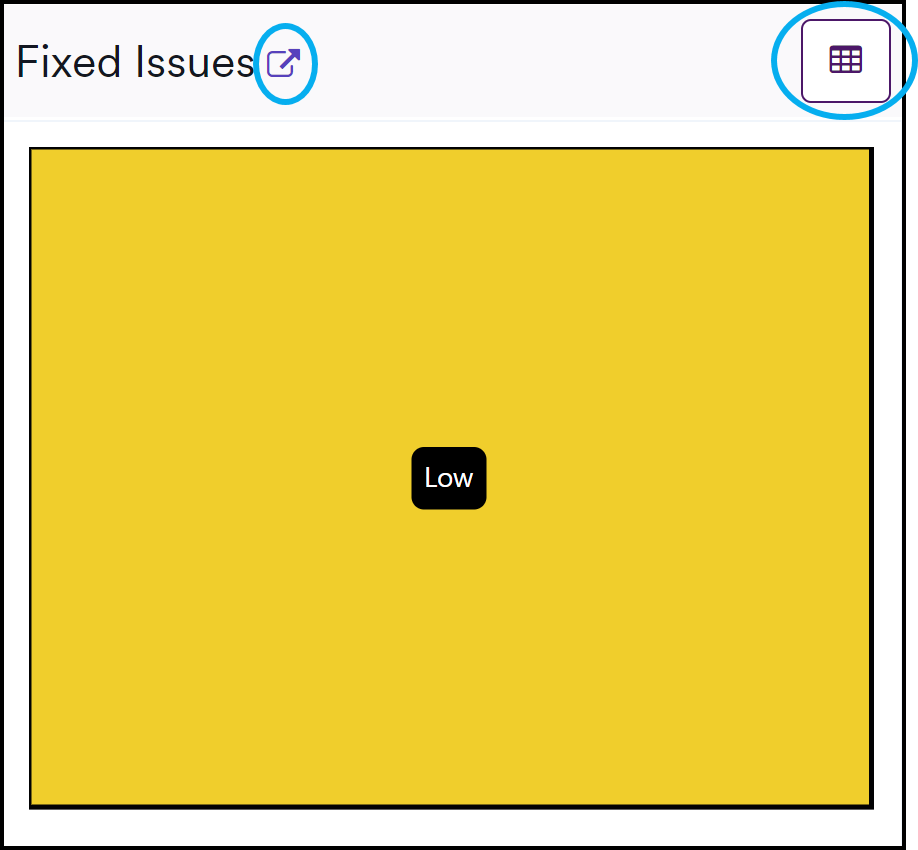
Fixed issues
Shows a column chart of issues fixed per Vulnerability Severity Level within the specified date range. Clicking the link takes you to Issues > All issues, filtered by the target configuration.
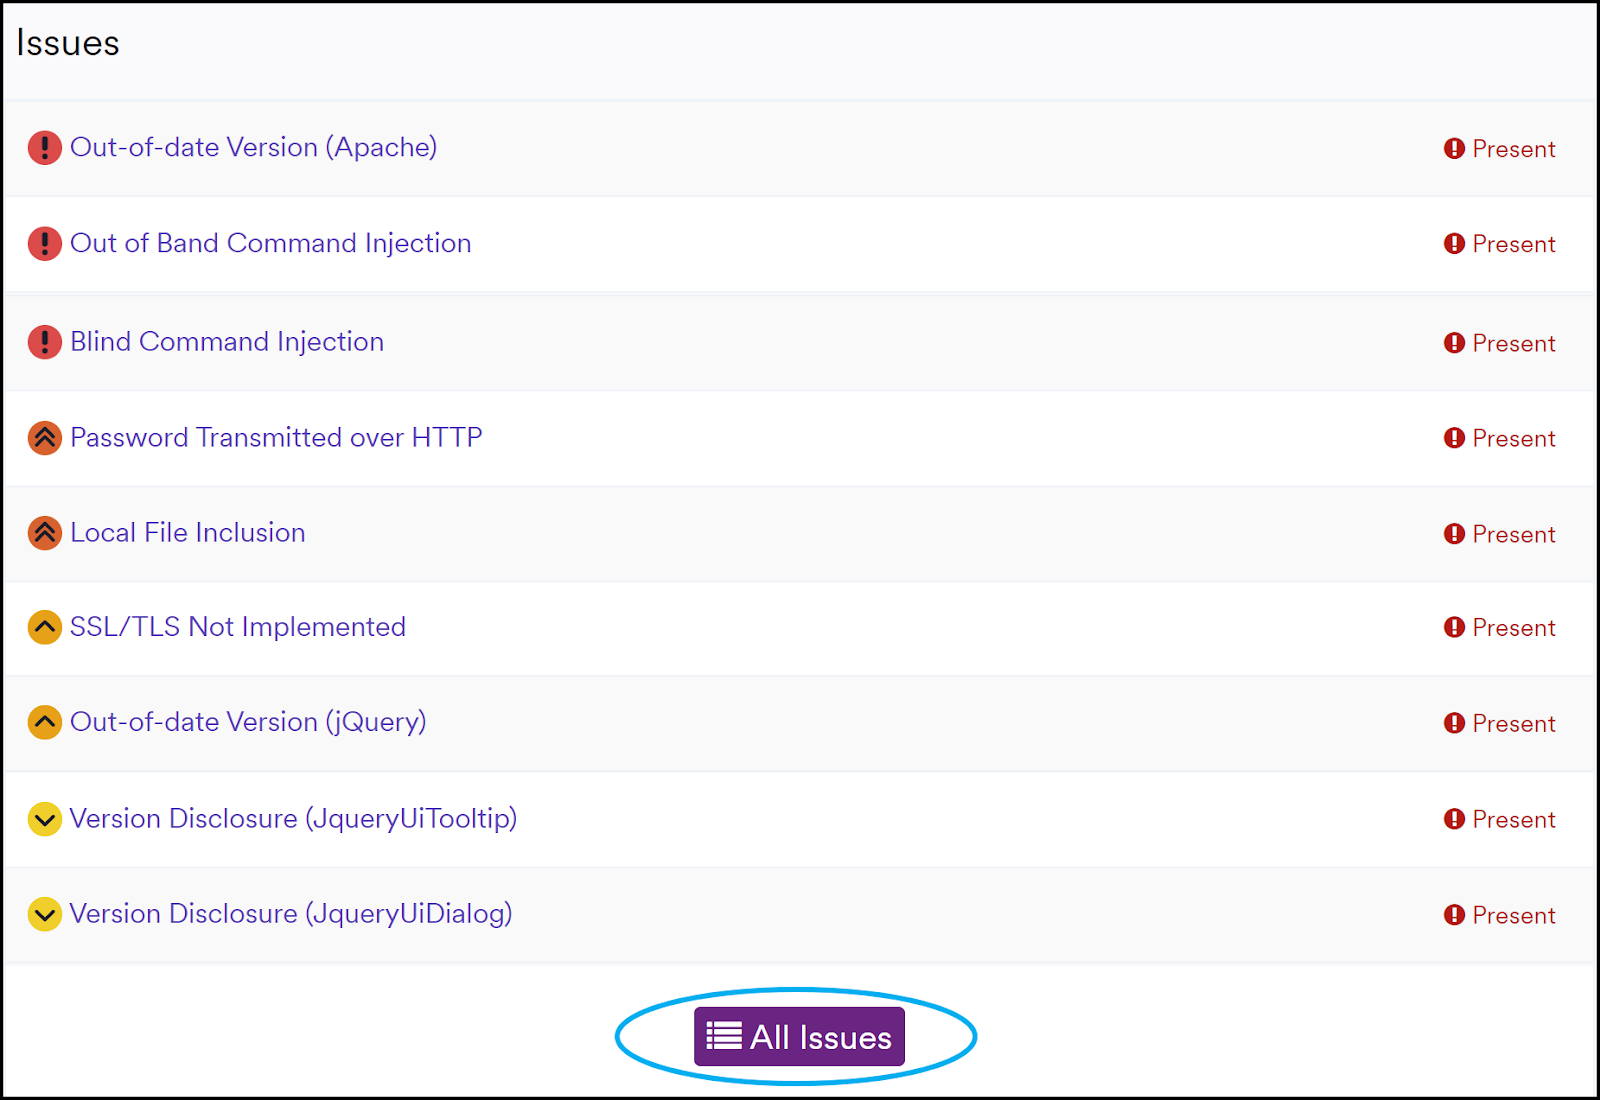
Issues
Displays a table of issues grouped by severity level. Clicking All Issues navigates to Issues > All Issues.
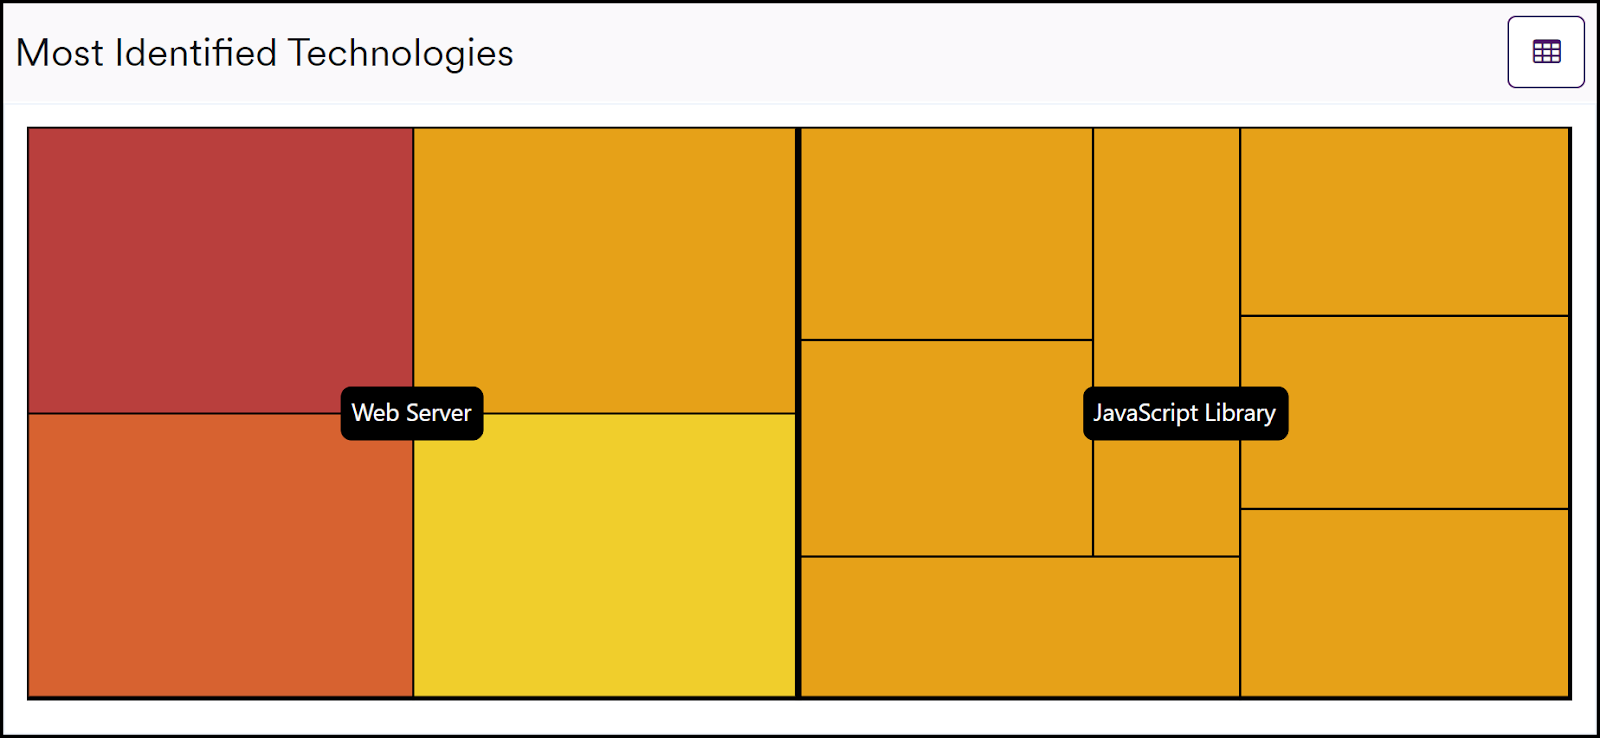
Most identified technologies
Shows versions of the most commonly identified technologies. Clicking panels navigates to the Technologies Dashboard.
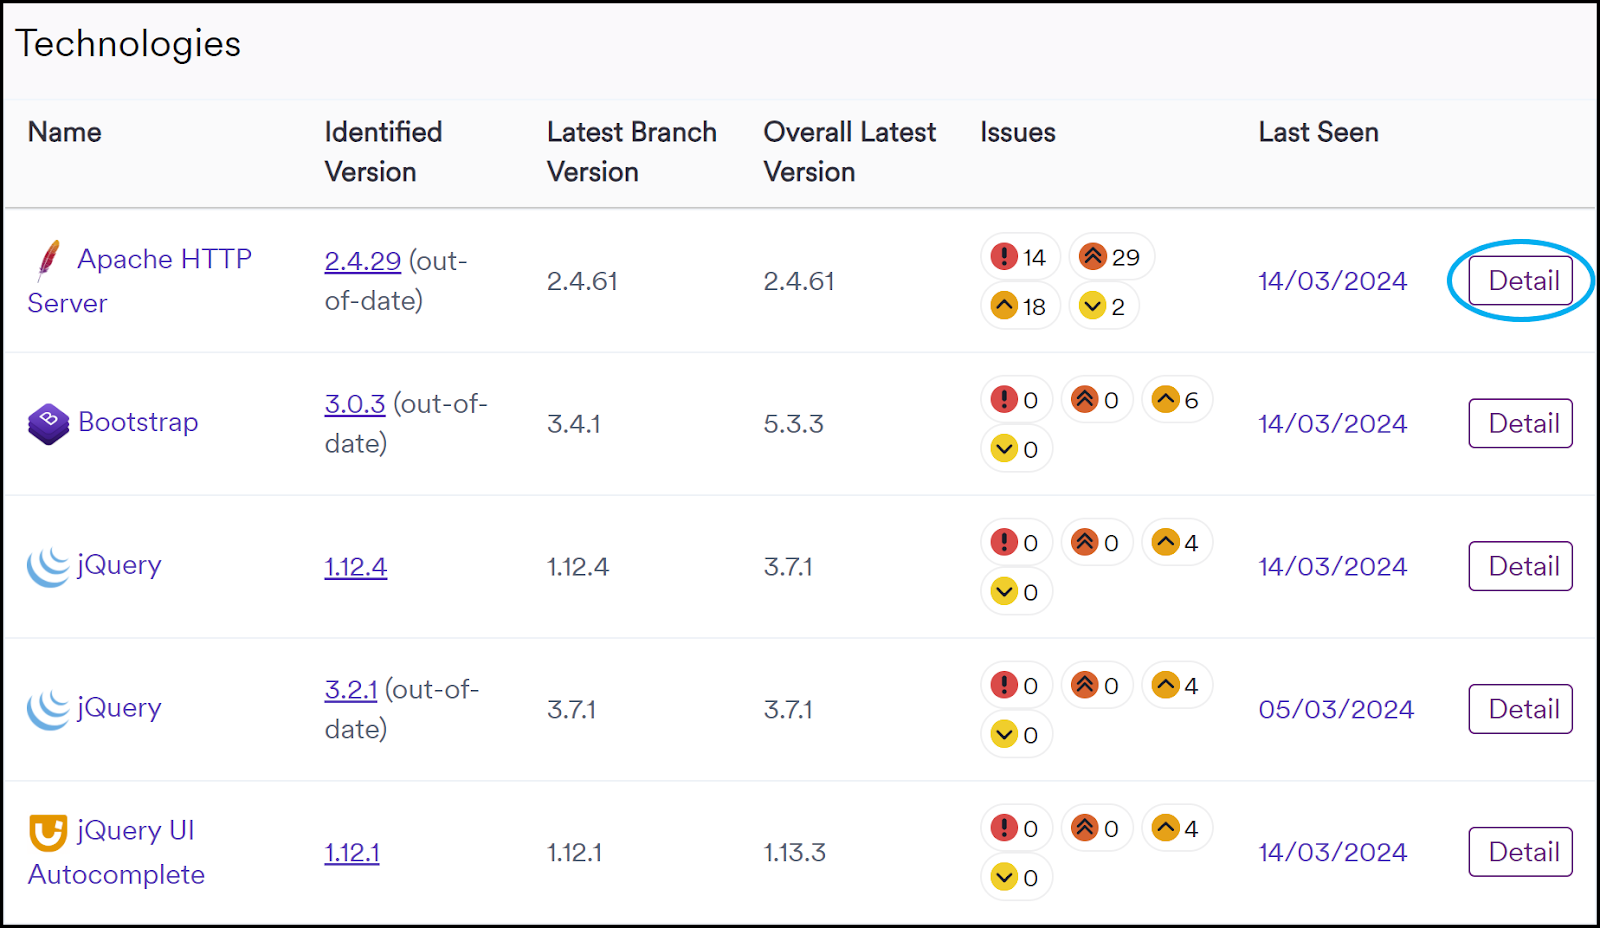
Technologies
Provides a summary of detected technologies, including outdated ones, latest branch versions, overall latest versions, and associated issues. Click Detail to visit the Technology Detail page.
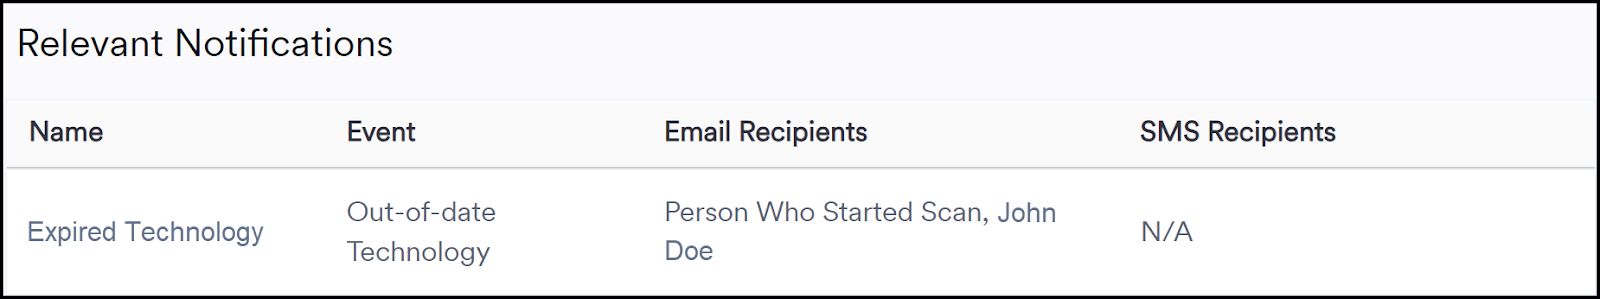
Relevant notifications
Compiles all notifications from the scan, showing Name, Event, Email Recipients, and SMS Recipients.
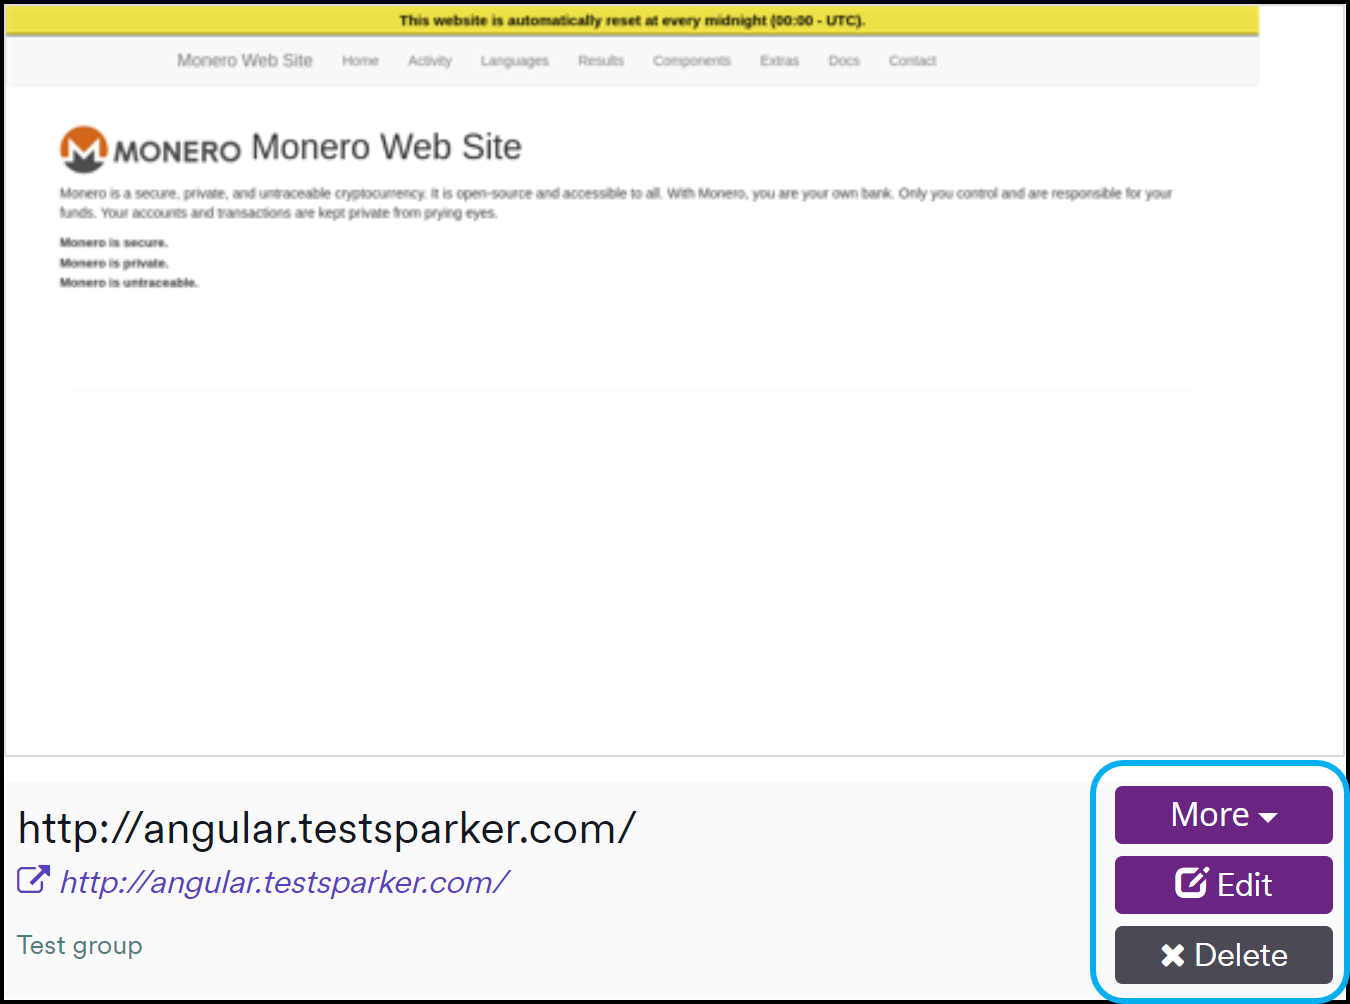
Target preview
Shows an image of the target, target name, URL, and target group.
The More drop-down includes:
- Issues: Redirects to Issues > All Issues
- Scans: Redirects to Scans > Recent Scans
- Scheduled Scans: Redirects to Scheduling > Scheduled Scans
The Edit button opens Edit Target; Delete removes the target permanently.
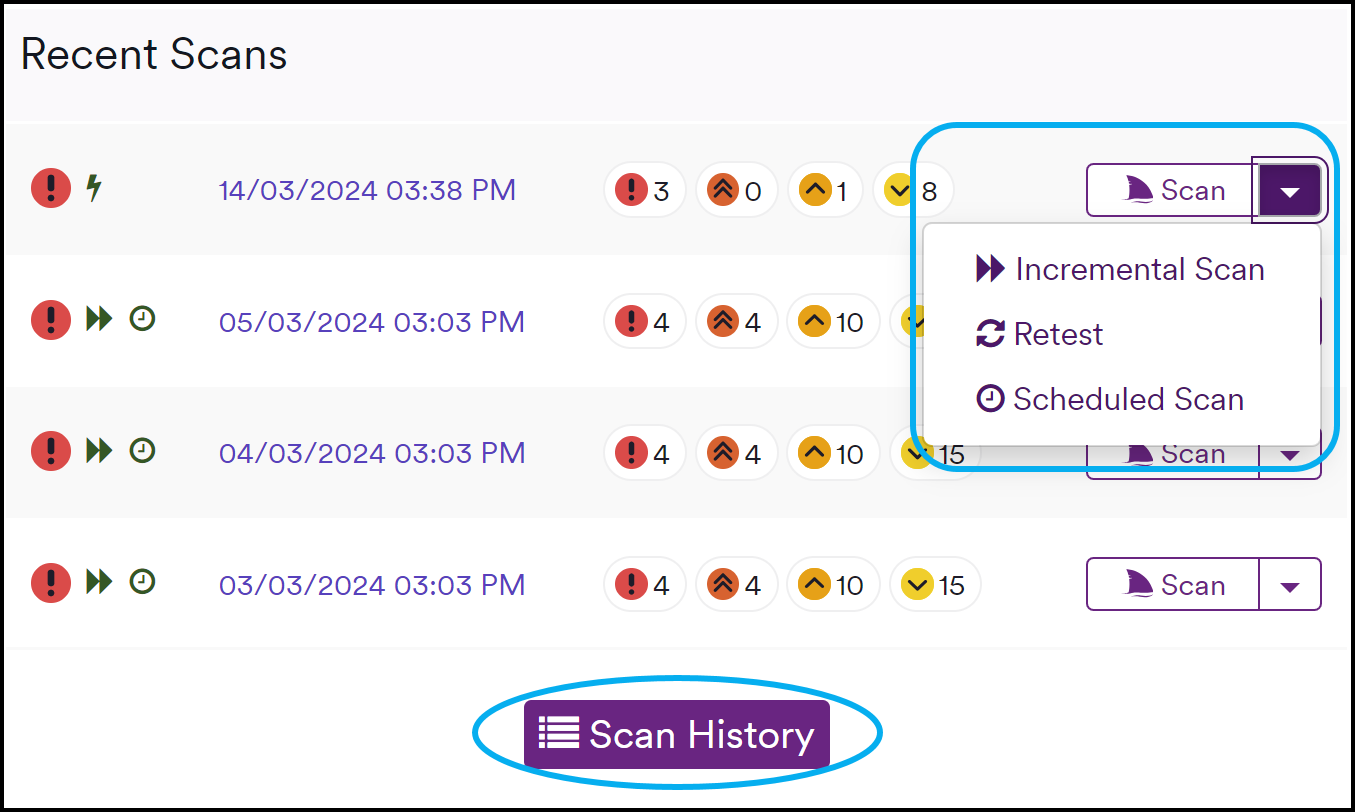
Recent scans
Displays all recent scans (In Progress or Completed) with counts per severity level. Actions include:
- Click a scan to open its Scan Summary.
- Click Scan to run a new scan with the same configuration.
- Create an Incremental scan via the down arrow.
- Perform a Retest via the down arrow.
- Create a Scheduled scan via the down arrow.
The Scan History button navigates to Scans > Recent Scans.
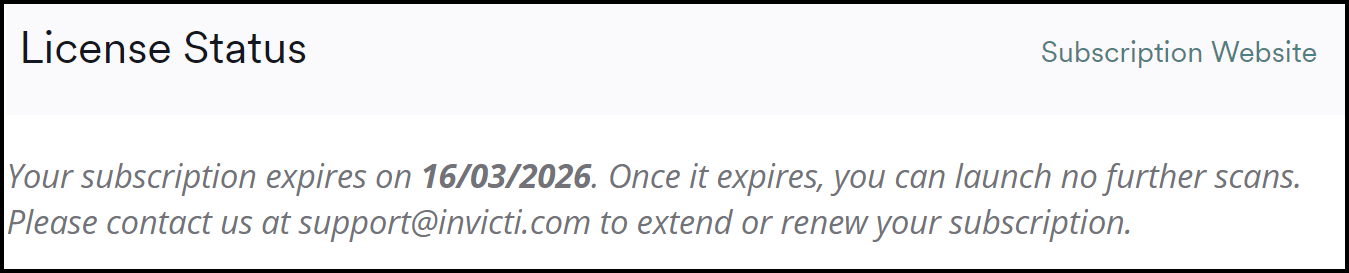
License status
Shows your Invicti subscription expiry dates.
Other dashboards
For information about other dashboards, refer to:
Need help?
Invicti Support team is ready to provide you with technical help. Go to Help Center