Deployment: on-demand and on-premises
Troubleshoot failed scans
Scans can fail or complete with errors for several reasons. This document helps you identify the cause and take the right action.
For a full list of scan statuses and what they mean, see Scan statuses and error messages.
Why this matters
When a scan fails or produces fewer results than expected, the cost and time spent on troubleshooting can quickly exceed the cost of resolving the underlying issue. Understanding the common failure patterns - and knowing where to look first - helps you diagnose problems in minutes rather than hours. Many scan failures are caused by straightforward configuration issues (firewall rules, authentication, target availability) that you can fix immediately once identified.
If you are not sure where to start, start with connectivity and trustlist-related issues. In many cases, failed scans are caused by the target being unreachable, blocked, or intermittently unavailable to the scanning engine.
Step 1: Check the scan activity log
The activity log is your first source of information when a scan fails.
- Select Scans > DAST scans from the left-side menu.
- Click the failed scan to open it.
- Select Activity and review the log entries for error or warning messages.
The log entries indicate whether the failure is related to connectivity, authentication, rate limiting, or an internal engine issue.
Quick diagnosis path
Use the scan status and the first visible log message to narrow the issue quickly.
- If the scan status is Aborted and the log shows repeated connectivity problems, start with Scan aborted: 25 consecutive network errors.
- If the scan fails before crawling starts, go to Scan fails at startup: target not reachable.
- If the log shows
Process exit with -1, go to Scan fails: process exit with -1. - If the log shows HTTP 429 responses or the target server shows high CPU usage, go to Scan fails or CPU spikes: concurrent request limit vs. server-side rate limiting.
- If the scan completes with warnings and coverage looks incomplete, go to Scan completes with warnings: authentication issues.
- If the log mentions additional hosts removed from scope, go to Scan completes with warnings: allowed hosts not reachable.
Common failure causes
Scan aborted: 25 consecutive network errors
If the scan status is Aborted, the most common cause is 25 consecutive network errors. The scanner stops the scan automatically when this threshold is reached.
What to review:
- Verify the target is accessible from the scanning engine.
- Review your firewall and trustlist settings to ensure the scanner's IP addresses are allowed.
- Check whether the target went offline or became unresponsive during the scan.
For a detailed explanation of what is and is not counted as a network error, see Preflight checks and network errors.
Scan fails at startup: target not reachable
If the scan fails before it begins or immediately after starting, the scanner couldn't connect to the target during the preflight stage.
What to review:
- Open the target URL in a browser from the same machine or network as the scanning engine.
- Confirm the target is accessible on the correct port and protocol.
- If you use an internal scanning agent, verify the agent is running and can reach the target.
See Preflight checks and network errors for details on how the preflight process works.
Scan fails: process exit with -1
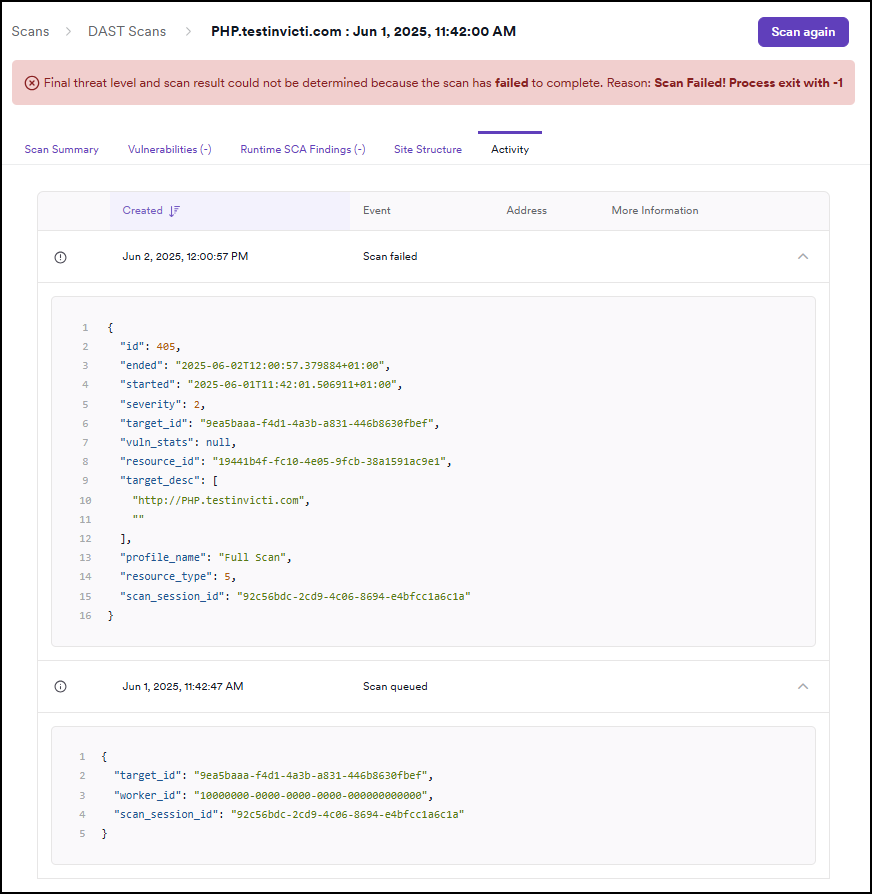
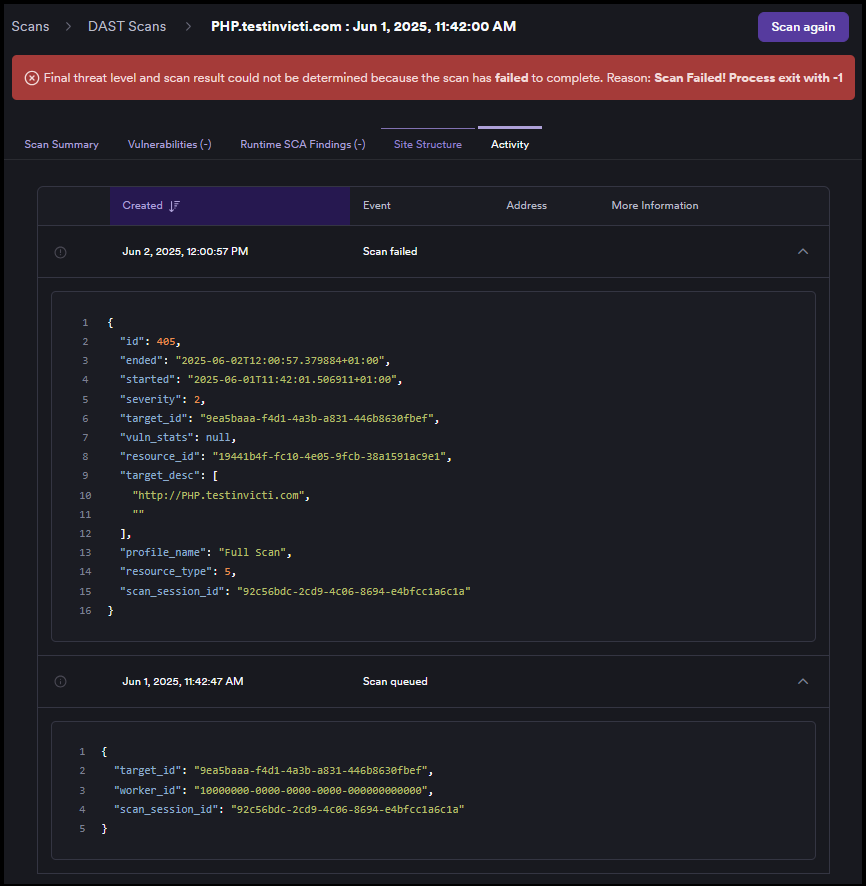
If the scan activity log includes a message such as Reason: Scan Failed! Process exit with -1, the scan engine process ended unexpectedly before the scan completed.
Because the scan did not finish, Invicti Platform can't determine the final threat level or final scan result. In this case, -1 is treated as an abnormal engine exit rather than a normal scan warning or a completed scan with partial results.
What to review:
- Review the Activity log entries immediately before the
Process exit with -1message. - If you use an internal scanning agent, review whether the agent service, container, or host restarted during the scan.
- Review the agent host for resource pressure such as high CPU usage, low memory, or low disk space.
- Check whether endpoint protection or another system process interrupted the scan engine.
- Run the scan again to determine whether the failure was transient.
If the same failure happens again, collect the scan ID, approximate failure time, affected Target, and any relevant agent logs before contacting support.
Scan fails or CPU spikes: concurrent request limit vs. server-side rate limiting
Scans generating high CPU usage on the target server, or producing large numbers of concurrent-https limit hit DEBUG messages in the scan log, can indicate two different issues that are easy to confuse.
Client-side: concurrent request limit (engine)
The scan engine limits itself to 10 concurrent HTTPS requests (limitConcurrentRequests: 10). When this limit is reached, the engine queues additional requests and logs a DEBUG-level concurrent-https limit hit message. This is expected behavior and does not indicate a problem with the target.
Server-side: target rate limiting
The target server itself can enforce rate limits and reject requests when it is overwhelmed. This is indicated by HTTP 429 (Too Many Requests) response codes in the scan log - not by DEBUG messages.
How to tell them apart:
| Symptom | Cause | Where to look |
|---|---|---|
concurrent-https limit hit in DEBUG logs | Client-side engine queue | Scan activity log (DEBUG level) |
| HTTP 429 responses | Server-side rate limit | Scan activity log (HTTP response codes) |
| High CPU on target server | Server overloaded | Target server monitoring |
What to do if the target is being rate-limited:
- Reduce the scan speed in Target settings > Scan speed.
- Schedule the scan during off-peak hours using an excluded hours profile.
- See Reduce scan times for additional optimization options.
Scan completes with warnings: authentication issues
If the scan completes but shows fewer results than expected, or warnings indicate pages were skipped, the scanner may not have been able to authenticate.
What to review:
- Verify that your login sequence or form authentication credentials are still valid.
- Re-record the login sequence if the target's login form has changed.
- Check the Activity log for messages about authentication failures or session expiry.
Scan completes with warnings: allowed hosts not reachable
If the scan scope includes additional hosts (Allowed hosts) and some are not reachable, those hosts are removed from the scan scope and the scan continues with a warning.
What to review:
- Review the Activity log for messages about specific hosts being removed from scope.
- Verify those hosts are accessible from the scanning engine.
Confirm the fix
After you make a change, run another scan and confirm that the issue is resolved.
- Run a new scan against the same Target.
- Review the Activity log and confirm that the previous warning or error message no longer appears.
- Check that the scan progresses normally and that the results match your expected coverage.
If the issue isn't resolved
If the same problem continues after you complete the relevant checks, collect the following details before contacting support:
- The scan status and the exact message from the Activity log
- The affected Target URL and whether the issue affects one Target or multiple Targets
- The approximate time of the failed scan
- Any recent changes to authentication, firewall rules, certificates, or rate-limiting settings
Providing this information helps the support team identify the cause faster.
Related documentation
- Scan statuses and error messages
- Preflight checks and network errors
- Reduce scan times
- Assign an excluded hours profile to a target
- Consequences of scanning without trustlisting
Need help?
Invicti Support team is ready to provide you with technical help. Go to Help Center