Scan summary dashboard
The Invicti Standard Scan Summary dashboard enables you to view the results of the latest security scan for a single website, both while the scan is running and once it has been completed. This document explains the information available to view on the Scan Summary dashboard.
View the Scan Summary Dashboard
To access the Scan Summary dashboard, follow these steps:
-
Log in to Invicti Standard.
-
Load a previous scan (File > select one of your local scans) or launch a new scan (Home > New).
-
Select View from the menu.
-
The default view displays the following panels:
-
Activity
-
Logs
-
Sitemap
-
Issues
-
Knowledge Base
-
Progress
-
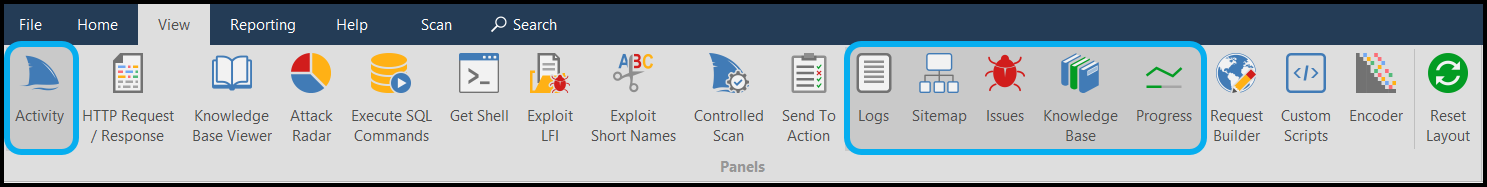
- Optionally, customize the displayed panels by selecting or deselecting panels from the ribbon.
Each of the panels is explained in the next section of this document.
To reset the dashboard layout to the default view, click Reset Layout in the View ribbon or use the shortcut Ctrl+Shift+R.
Scan Summary Dashboard panels
The following panels are available to view on the Scan Summary dashboard. When multiple panels are selected from the ribbon, they appear as tabs within the dashboard window. Select a tab to view the information available. You can adjust the size of the panels displayed in the dashboard by dragging the borders.
Activity
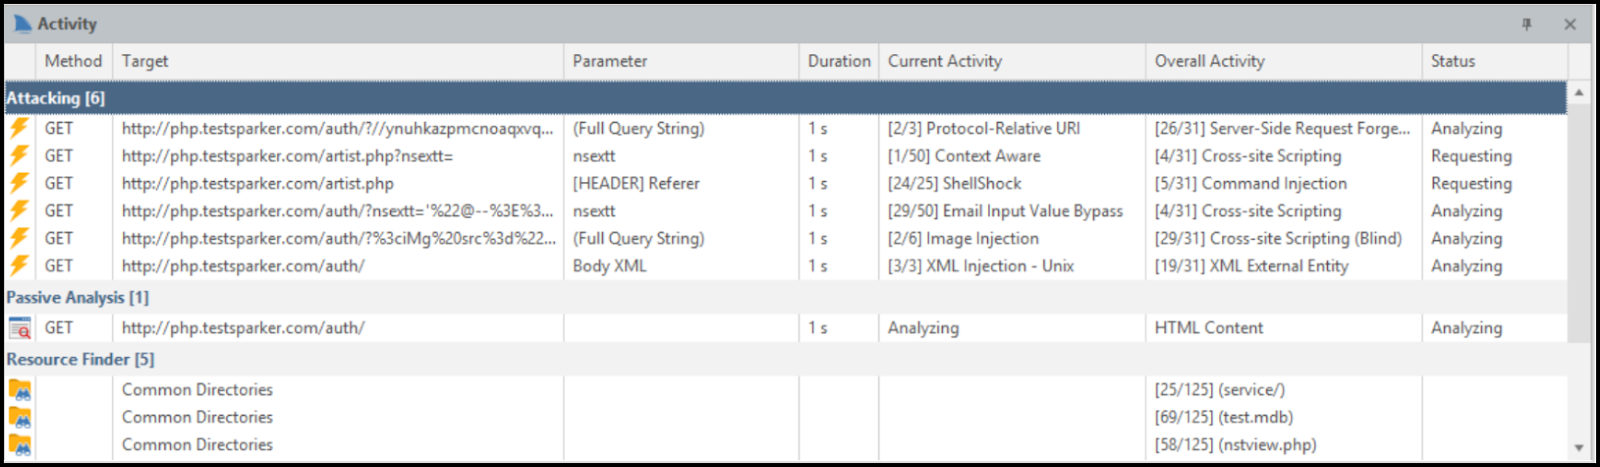
The Activity panel at the bottom center of the dashboard displays current scan activities. During a scan, it provides information in real time about HTTP requests and which files and parameters are being crawled or scanned. The information is presented using the following columns:
-
Method: The HTTP request method (for example, GET, POST).
-
Target: The URL currently being crawled or scanned.
-
Parameter: The URL parameter being scanned.
-
Duration: The length of the current operation (attacking or scanning).
-
Current Activity: The specific security check that is currently in progress (for example, ShellShock is 24 th out of 25 checks in the Command Injection group).
-
Overall Activity: The security check group currently being executed (for example, Command Injection, is 4th out of 31 groups).
-
Status: The current process stage (for example, analyzing, requesting, parsing, confirming).
Progress
The Progress panel shows Scan Speed and Scan Progress as a percentage from 0 to 100%. It includes a Requests per second slider that adjusts the rate of requests sent per second when clicked anywhere on the slider.
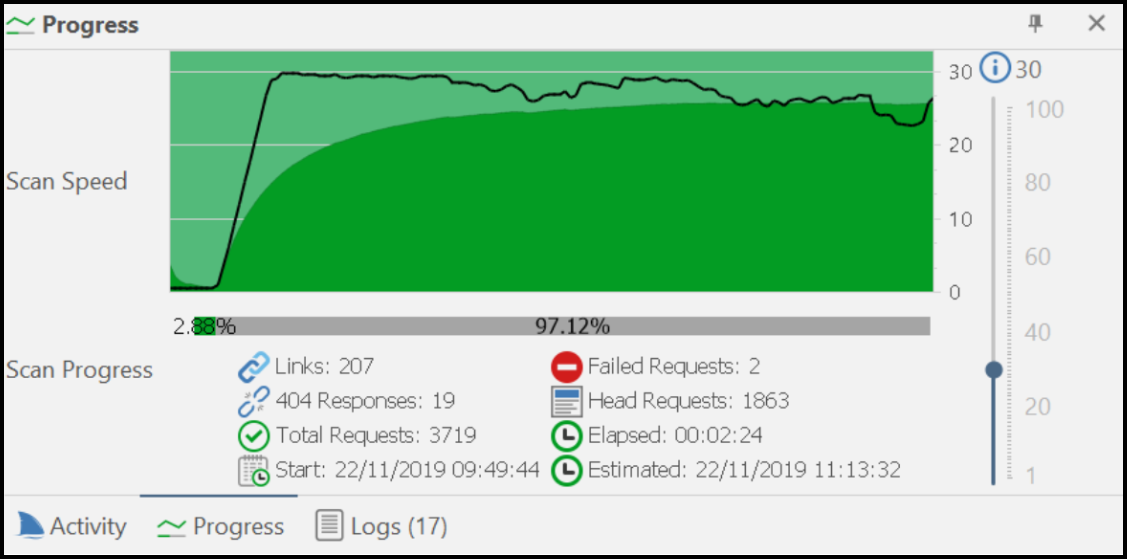
The Scan Progress bar estimation calculation is determined by engine runtimes, which include the actual time required for processing requests and analyzing their responses. This calculation involves CPU-intensive operations such as DOM simulation. The Scan progress panel also provides information on:
-
Link
-
404 Responses
-
Total Requests
-
Start (date and time)
-
Failed Requests
-
Head Requests
-
Elapsed (time)
-
Estimated
The Scan Speed and the duration of a web scan depends on many factors, such as the size and complexity of the target website, the availability of bandwidth between the scanner and the target, the target's response time, and the number of security checks for which the target is being scanned. For more information, refer to How Fast is Your Web Vulnerability Scanner?
Logs
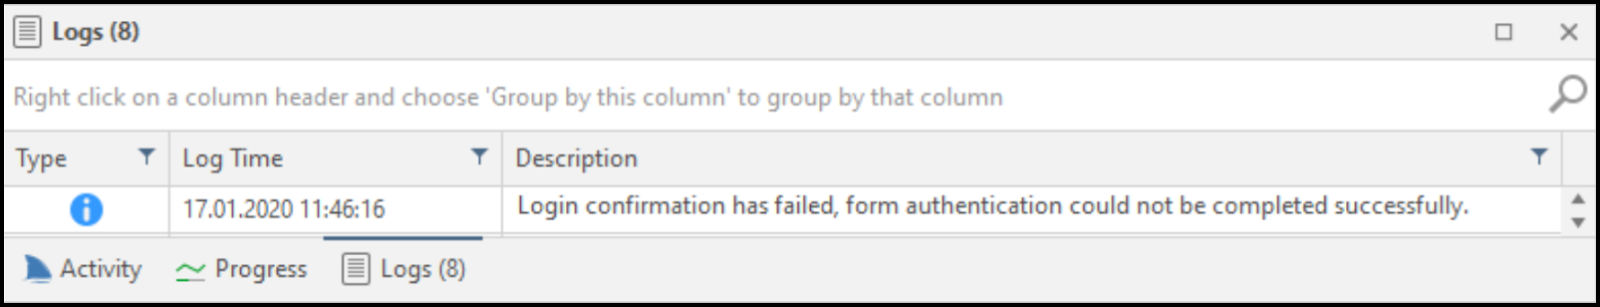
The Logs panel displays a list of all scanner actions that have taken place during the scan and confirms detected logouts. It also notifies users of login failures due to changed credentials.
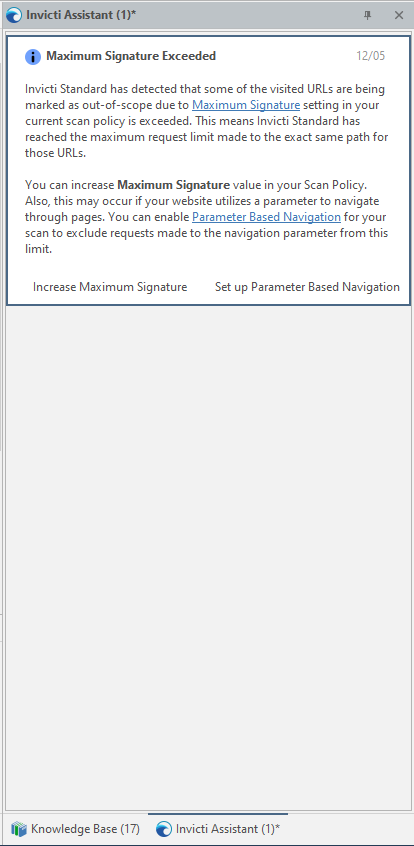
Invicti Assistant
Invicti Assistant is a smart scan assistant that guides you through a scan, detecting and displaying details of scan configuration anomalies, and enabling you to change and optimize the current configuration. The Invicti Assistant is displayed on the right-hand side of the dashboard along with the Knowledge Base.
You can switch between viewing the Knowledge Base and Invicti Assistant by clicking the relevant tab. For more information, refer to the Invicti Assistant documentation.
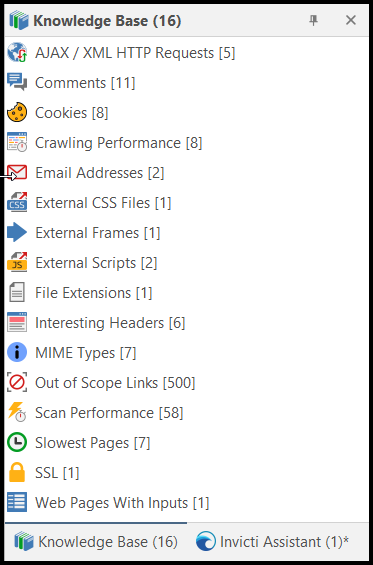
Knowledge Base
The Knowledge Base displays a list of additional information (knowledge base nodes) about the scan, sorted into groups. Click on each one to view its details, which are displayed in the central panel of the dashboard (Knowledge Base Viewer). For more information about Knowledge Base nodes, refer to the specific Knowledge Base Nodes documentation. Additional information is also available in the Knowledge Base Tab section of the Technical Report documentation.
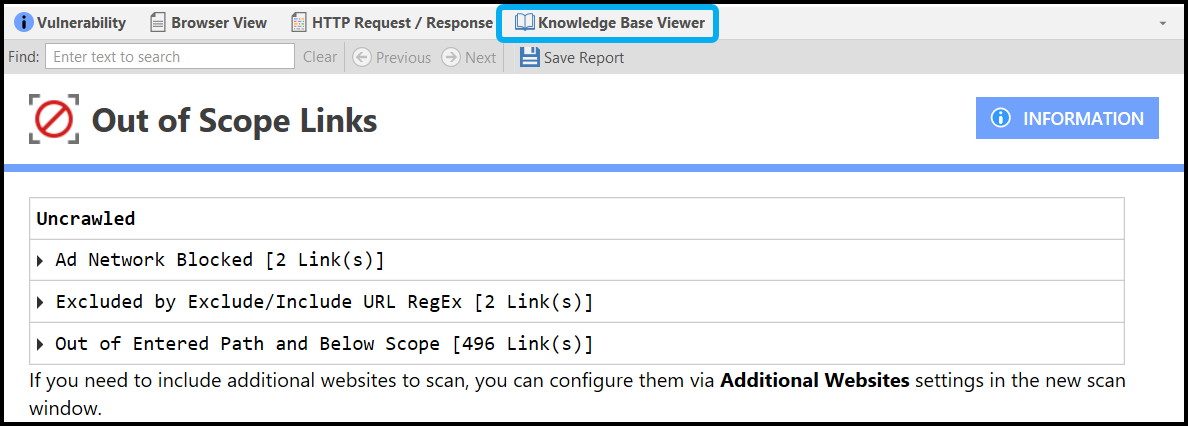
Knowledge Base Viewer
The Knowledge Base Viewer displays details in the central panel about the last item selected in the Knowledge Base. It also provides search and Save Report options.
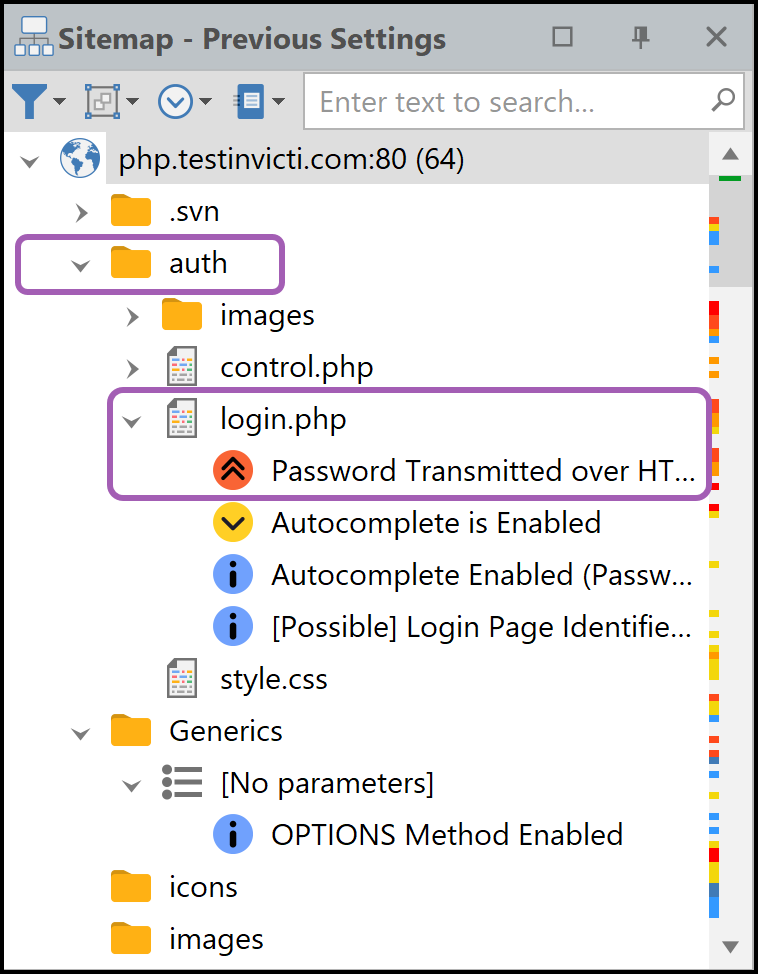
Sitemap
The Sitemap displays a list of all the directories and files crawled by the scanner. Within each node, all identified vulnerabilities, security flaws, and vulnerable parameters are listed. In the following example:
-
The directory is auth
-
The file is login.php
-
The first vulnerability listed is Password Transmitted over HTTP
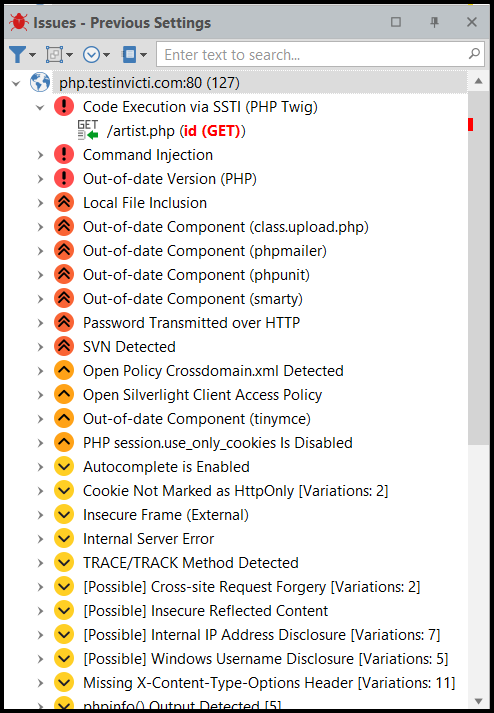
Issues
The Issues panel lists all detected vulnerabilities and other issues. When you select a vulnerability from the list, more information about that vulnerability is displayed in the central panel of the dashboard. For more information, refer to Viewing Issues in Invicti Standard and the Issues Tab section of our Technical Report documentation.
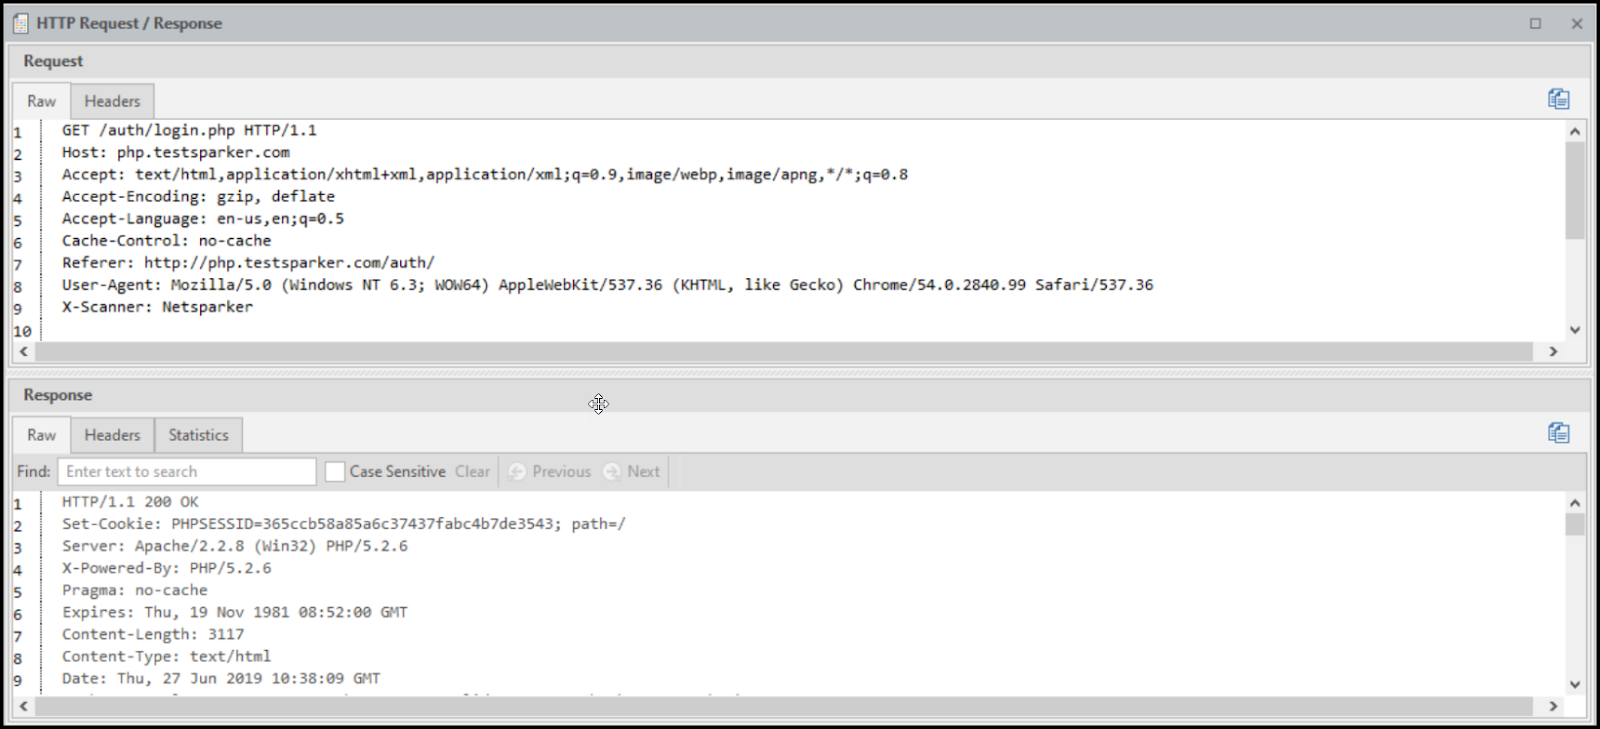
HTTP Request/Response
The HTTP Request/Response panel displays the request and response of whichever item you have selected from the Sitemap or Issues panels. For more information, refer to HTTP Request and How to View the HTTP Request and Response of an Issue in Invicti Standard.
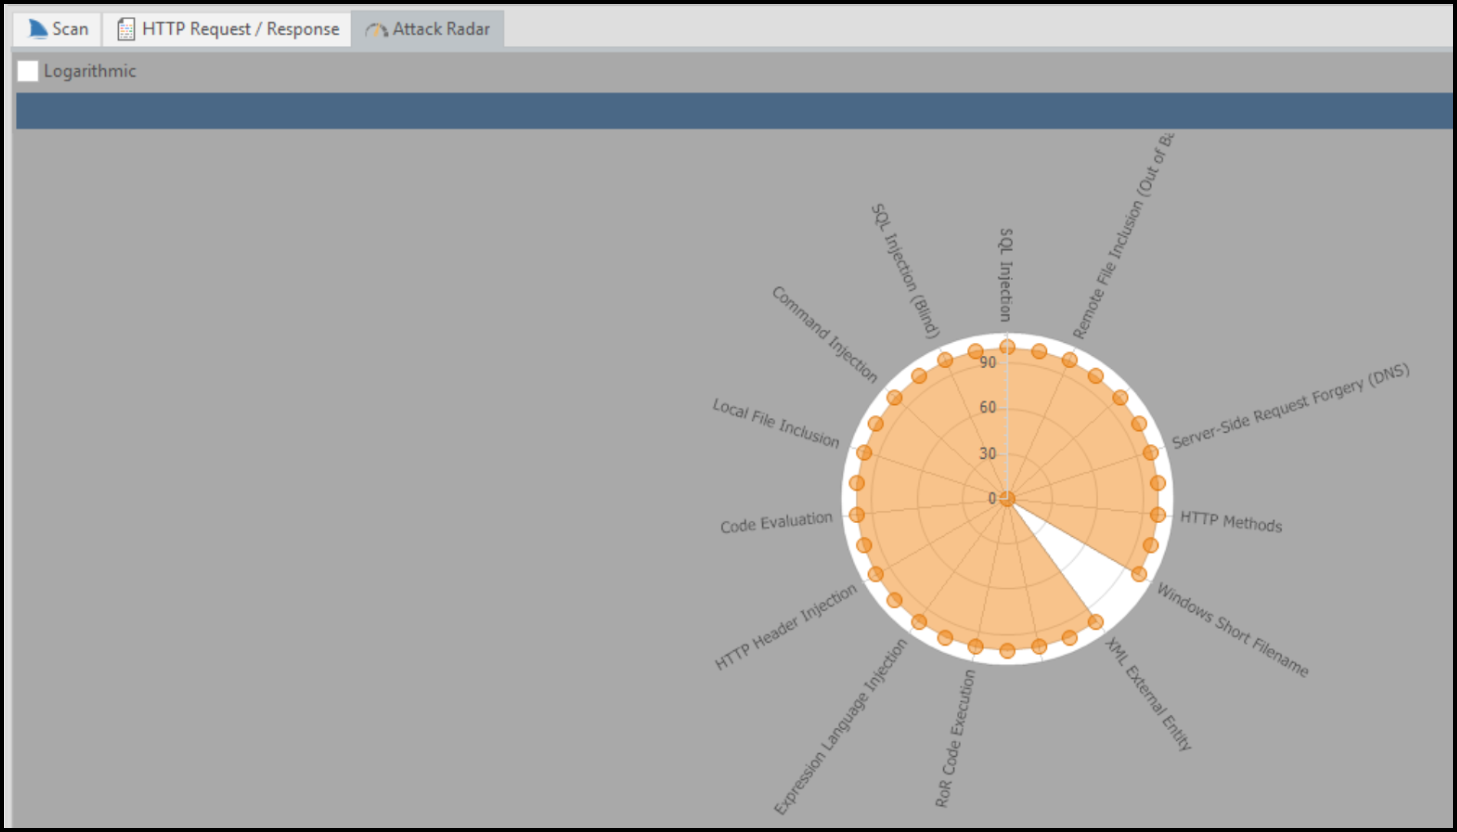
Attack Radar
The Attack Radar displays a circular chart that shows the progress of each security check (for example, SQLi, XSS) during the scanning phase, prior to most SQL Injection attacks being performed. At the end of the scan, the chart indicates all security checks that have been tested and the number of vulnerabilities found for each type.
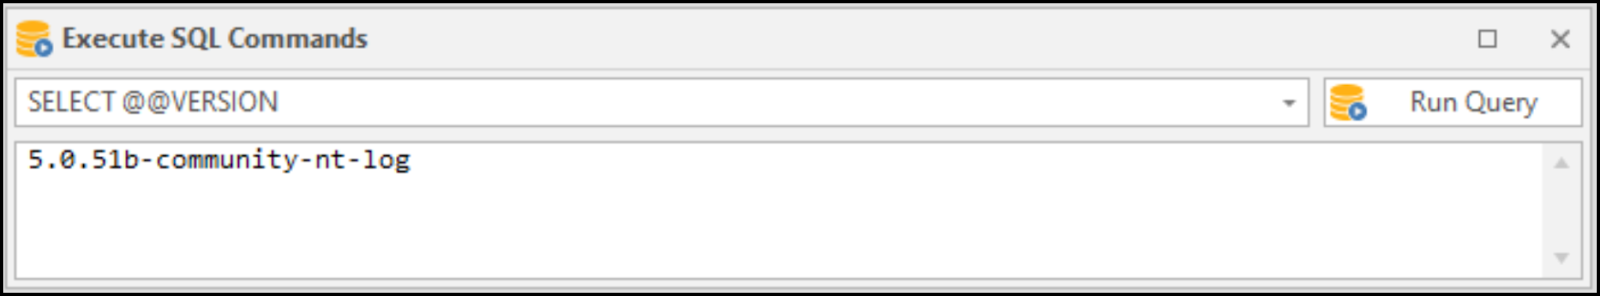
Execute SQL Commands
The Execute SQL Commands panel allows you to manually run SQL queries on the target server. These queries are executed through the vulnerability URL. The panel updates the URL with the given query, sends it to the server, and displays the response. This panel is activated when an exploitable SQL Injection vulnerability is selected.
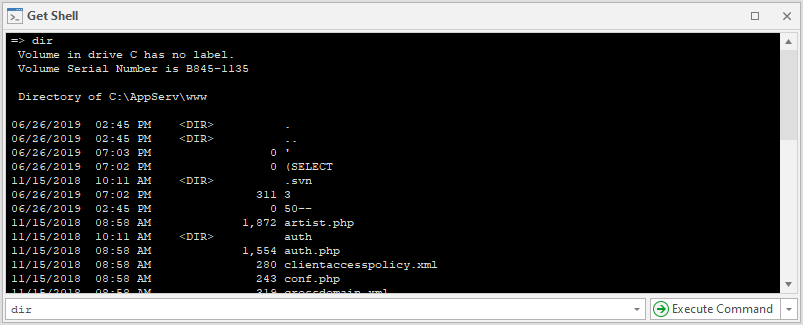
Get Shell
The Get Shell panel executes OS commands on the target web application's server. It updates the URL with the specified command, sends it to the server, and displays the response. This panel is enabled when an exploitable Command Injection, Code Evaluation, Code Execution, or similar vulnerability is selected.
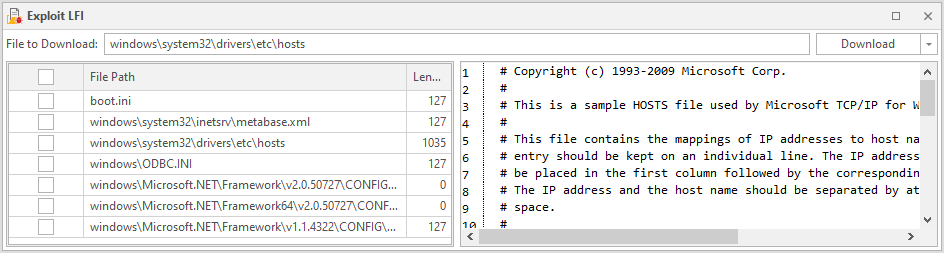
Exploit LFI
The Exploit LFI panel reads the contents of files on the target web server by exploiting a Local File Inclusion (LFI) vulnerability detected during the scan.
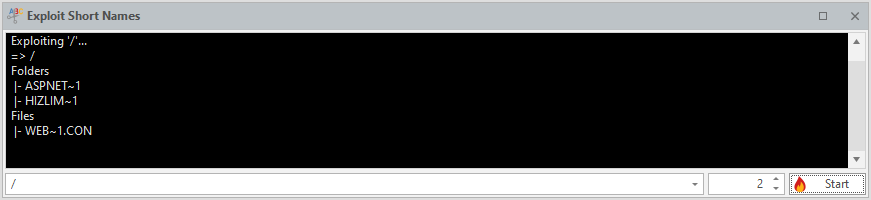
Exploit Short Names
The Exploit Short Names panel specifies the path to be exploited and displays the results. A short path name is an MS-DOS-compatible version of a file name created by Windows. For example, a file named backup-a8accb12bb74411eb248a1a05b0b0ecb.sql might have a short path name like BACKUP~1.SQL.
The Short Filename vulnerability allows remote attackers to reveal important file and folder names that are typically inaccessible from outside, providing insight into the application infrastructure. This can lead to the leakage of sensitive files, such as credentials, configuration files, and maintenance scripts. For more information, refer to our Windows Short Filename vulnerability page.
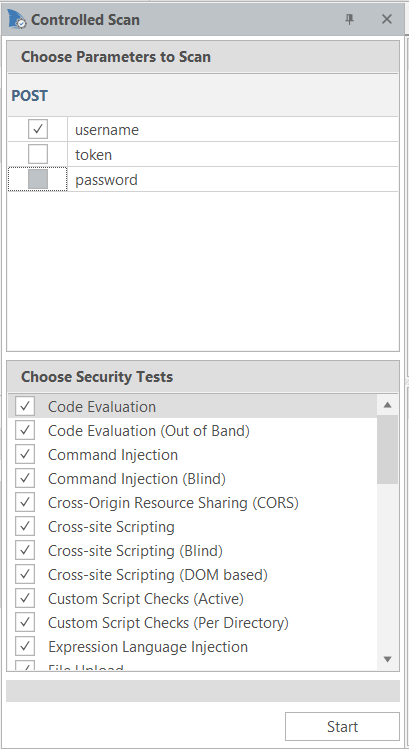
Controlled Scan
The Controlled Scan panel displays the Parameters to Scan and the Security Tests you can select. It allows you to scan a single page or parameter for a specific set of vulnerabilities. For more information, refer to Creating a Controlled Scan in Invicti Standard.
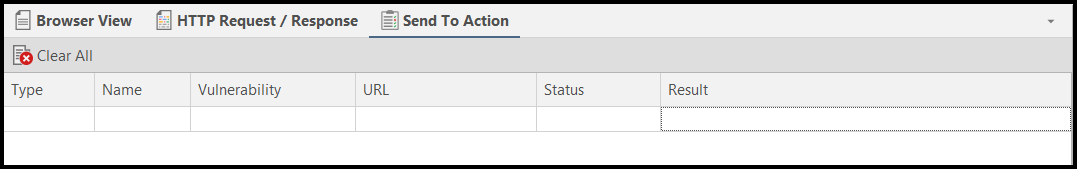
Send to Action
This panel provides an overview of all the automated responses that will be triggered based on the scan results. It helps you quickly understand what actions will be taken automatically and ensures that all necessary steps are in place to address detected vulnerabilities.
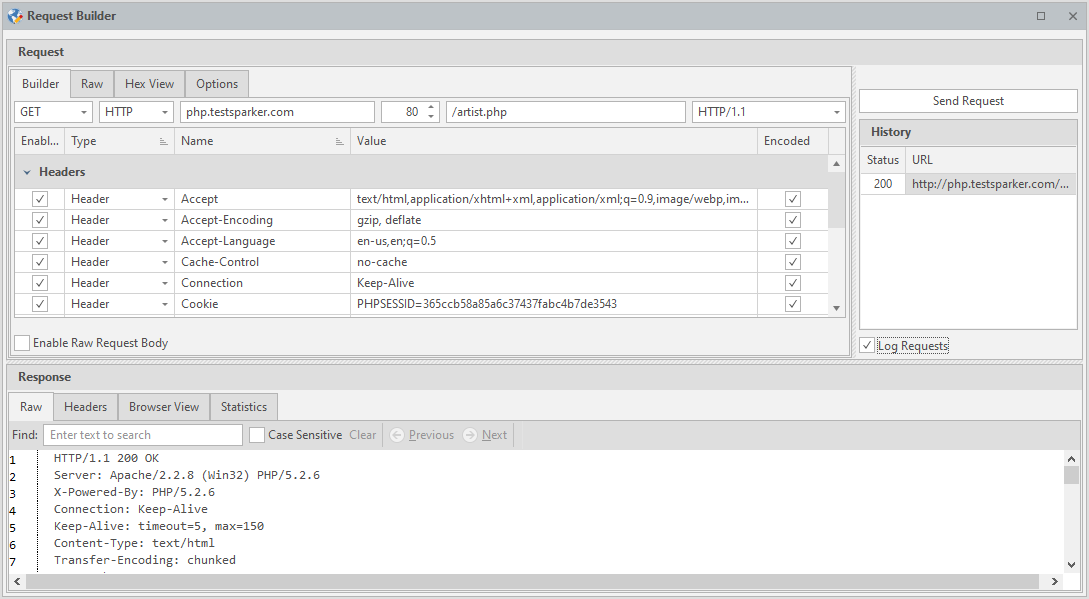
Request Builder
The Request Builder panel allows you to work with HTTP requests, enabling you to:
-
Send requests to the target
-
Modify imported HTTP requests
-
Create custom HTTP requests
-
Analyze and exploit vulnerabilities
-
Analyze the HTTP response
For more information, refer to the HTTP Request Builder documentation.
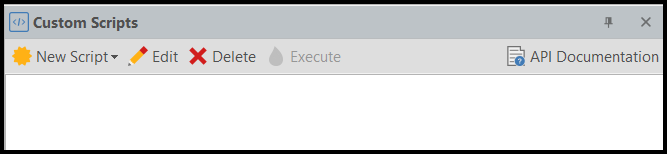
Custom Scripts
The Custom Scripts panel allows you to add new security checks to active, passive, singular, and per-directory attacks.
-
The New Script button allows you to create a new script that is then used in scans.
-
Clicking on API Documentation opens the Invicti Standard Custom Scripting API Docs window, where you can view API parameters.
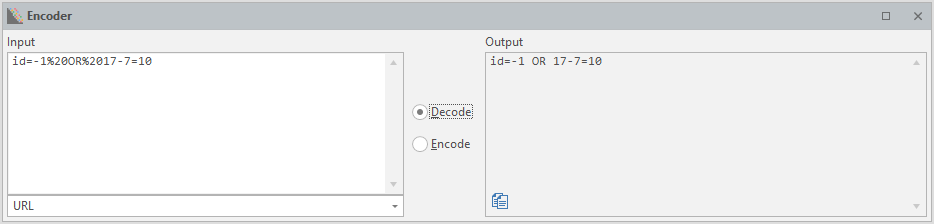
Encoder
The Encoder panel enables you to encode and decode text from and to various formats.
Need help?
Invicti Support team is ready to provide you with technical help. Go to Help Center